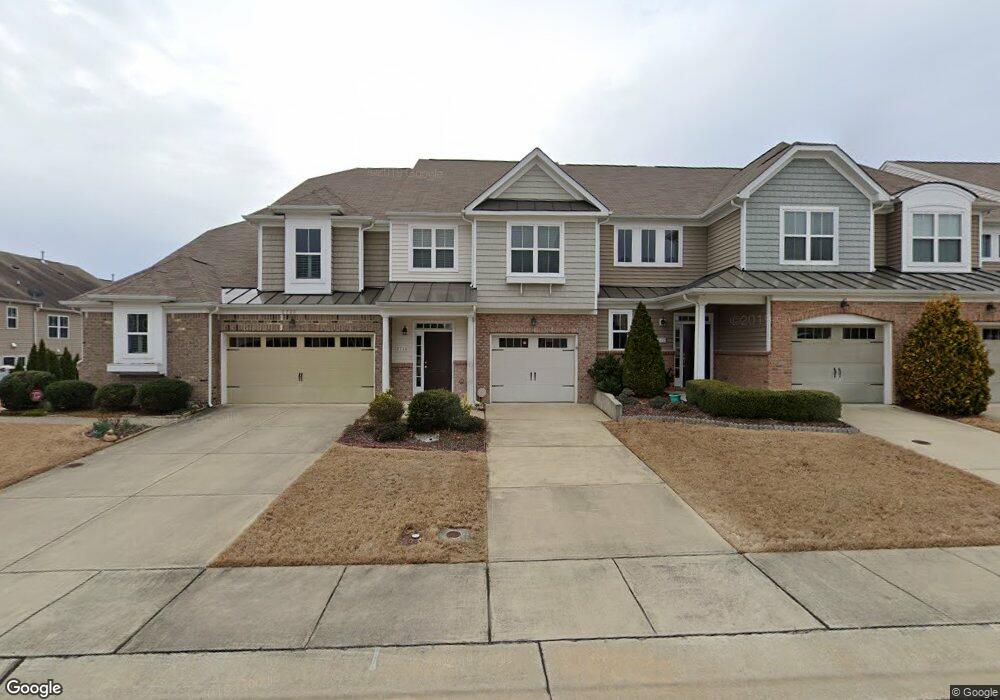
2716 Casper Creek Ln Raleigh, NC 27616
Forestville NeighborhoodEstimated Value: $331,279 - $368,000
--
Bed
1
Bath
1,826
Sq Ft
$192/Sq Ft
Est. Value
About This Home
This home is located at 2716 Casper Creek Ln, Raleigh, NC 27616 and is currently estimated at $350,070, approximately $191 per square foot. 2716 Casper Creek Ln is a home located in Wake County with nearby schools including Harris Creek Elementary School, Rolesville Middle School, and Rolesville High School.
Ownership History
Date
Name
Owned For
Owner Type
Purchase Details
Closed on
Apr 13, 2021
Sold by
Arulgnanam Walter D and Arulgnanam Walter Deni
Bought by
Arulgnanam Walter D and Arulgnanam Walter Carmalin
Current Estimated Value
Home Financials for this Owner
Home Financials are based on the most recent Mortgage that was taken out on this home.
Original Mortgage
$60,000
Outstanding Balance
$45,039
Interest Rate
3%
Mortgage Type
New Conventional
Estimated Equity
$305,031
Purchase Details
Closed on
Sep 27, 2010
Sold by
Centex Homes
Bought by
Arulgnanam Walter D and Walter Deni Carmalin A
Home Financials for this Owner
Home Financials are based on the most recent Mortgage that was taken out on this home.
Original Mortgage
$173,759
Outstanding Balance
$115,245
Interest Rate
4.45%
Mortgage Type
FHA
Estimated Equity
$234,825
Create a Home Valuation Report for This Property
The Home Valuation Report is an in-depth analysis detailing your home's value as well as a comparison with similar homes in the area
Home Values in the Area
Average Home Value in this Area
Purchase History
| Date | Buyer | Sale Price | Title Company |
|---|---|---|---|
| Arulgnanam Walter D | -- | Solidifi Title & Closing Llc | |
| Arulgnanam Walter D | $176,500 | None Available |
Source: Public Records
Mortgage History
| Date | Status | Borrower | Loan Amount |
|---|---|---|---|
| Open | Arulgnanam Walter D | $60,000 | |
| Open | Arulgnanam Walter D | $173,759 |
Source: Public Records
Tax History Compared to Growth
Tax History
| Year | Tax Paid | Tax Assessment Tax Assessment Total Assessment is a certain percentage of the fair market value that is determined by local assessors to be the total taxable value of land and additions on the property. | Land | Improvement |
|---|---|---|---|---|
| 2025 | $2,989 | $340,391 | $90,000 | $250,391 |
| 2024 | $2,976 | $340,391 | $90,000 | $250,391 |
| 2023 | $2,438 | $221,821 | $32,000 | $189,821 |
| 2022 | $2,266 | $221,821 | $32,000 | $189,821 |
| 2021 | $2,178 | $221,821 | $32,000 | $189,821 |
| 2020 | $2,139 | $221,821 | $32,000 | $189,821 |
| 2019 | $2,223 | $190,133 | $32,000 | $158,133 |
| 2018 | $2,097 | $190,133 | $32,000 | $158,133 |
| 2017 | $1,998 | $190,133 | $32,000 | $158,133 |
| 2016 | $1,957 | $190,133 | $32,000 | $158,133 |
| 2015 | $2,173 | $207,889 | $32,000 | $175,889 |
| 2014 | $2,061 | $207,889 | $32,000 | $175,889 |
Source: Public Records
Map
Nearby Homes
- Plan 1501 Modeled at Tucker Place
- Plan 1808 at Tucker Place
- Plan 2764 Modeled at Tucker Place
- Plan 1638 at Tucker Place
- Plan 1342 at Tucker Place
- Plan 2328 at Tucker Place
- Plan 1558 at Tucker Place
- Plan 2277 Modeled at Tucker Place
- 4007 Newell Ln
- 8341 Hollister Hills Dr
- 8504 Lasilla Way
- 2628 Pivot Ridge Dr
- 2821 Casona Way
- 2660 Princess Tree Dr
- 2410 Abbot Hall Dr
- 8520 Quarton Dr
- 8602 Holdenby Trail
- 2685 Princess Tree Dr
- 8117 Bright Oak Trail
- 3418 Longleaf Estates Dr
- 2720 Casper Creek Ln Unit 149
- 2712 Casper Creek Ln Unit 700
- 2708 Casper Creek Ln Unit 699
- 8331 Amador Way
- 8329 Amador Way
- 8329 Amador Way Unit 645
- 8327 Amador Way
- 8327 Amador Way Unit 646
- 2704 Casper Creek Ln
- 2704 Casper Creek Ln Unit 698
- 8325 Amador Way
- 8325 Amador Way Unit 647
- 8323 Amador Way
- 2700 Casper Creek Ln
- 8321 Amador Way
- 8321 Amador Way Unit 649
- 2717 Casper Creek Ln
- 2717 Casper Creek Ln Unit 639
- 2725 Casper Creek Ln
- 2713 Casper Creek Ln