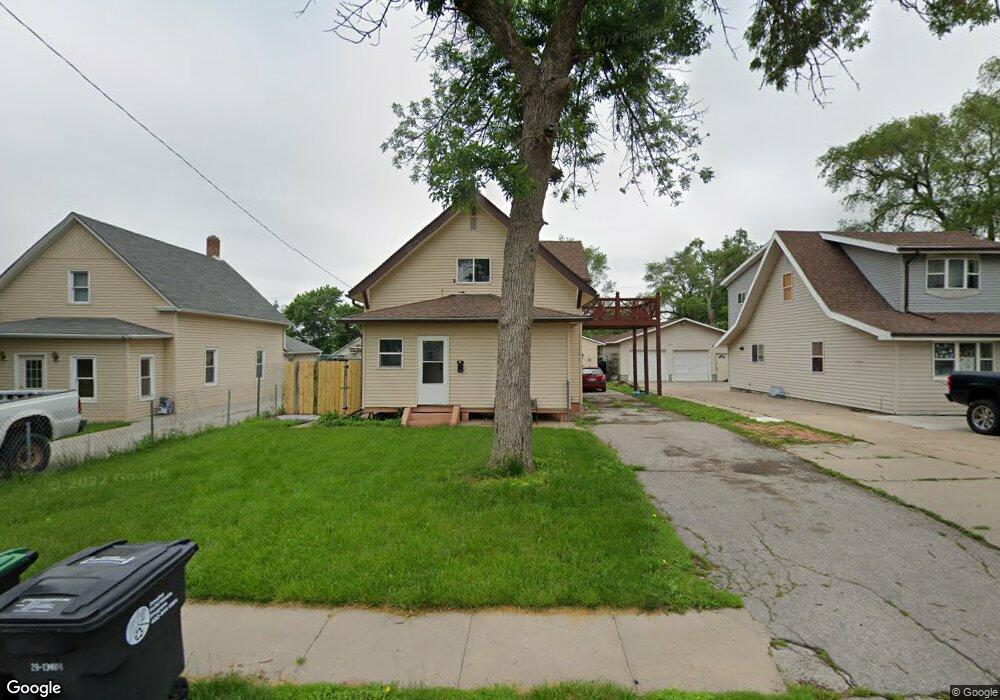
2716 Drexel St Omaha, NE 68107
South Central Omaha NeighborhoodEstimated Value: $195,000 - $216,000
4
Beds
2
Baths
1,502
Sq Ft
$136/Sq Ft
Est. Value
About This Home
This home is located at 2716 Drexel St, Omaha, NE 68107 and is currently estimated at $204,680, approximately $136 per square foot. 2716 Drexel St is a home located in Douglas County with nearby schools including Highland Elementary School, Bryan Middle School, and Bryan High School.
Ownership History
Date
Name
Owned For
Owner Type
Purchase Details
Closed on
Sep 24, 2022
Sold by
Robledo Jose A and Robledo Elvia
Bought by
Sanchez Brandon Gregory and Robledo-Sanchez Elvia Ruby
Current Estimated Value
Home Financials for this Owner
Home Financials are based on the most recent Mortgage that was taken out on this home.
Original Mortgage
$149,185
Outstanding Balance
$142,238
Interest Rate
5%
Mortgage Type
VA
Estimated Equity
$62,442
Purchase Details
Closed on
Dec 28, 2001
Sold by
Robledo Jose A and Robledo Elvia
Bought by
Robledo Jose A and Robledo Elvia
Purchase Details
Closed on
Sep 13, 2001
Sold by
Velasquez Rita
Bought by
Plascencia Miguel A and Roblede Jose A
Create a Home Valuation Report for This Property
The Home Valuation Report is an in-depth analysis detailing your home's value as well as a comparison with similar homes in the area
Home Values in the Area
Average Home Value in this Area
Purchase History
| Date | Buyer | Sale Price | Title Company |
|---|---|---|---|
| Sanchez Brandon Gregory | $145,000 | -- | |
| Robledo Jose A | -- | -- | |
| Robledo Jose A | $23,000 | -- | |
| Plascencia Miguel A | $26,000 | -- |
Source: Public Records
Mortgage History
| Date | Status | Borrower | Loan Amount |
|---|---|---|---|
| Open | Sanchez Brandon Gregory | $149,185 |
Source: Public Records
Tax History
| Year | Tax Paid | Tax Assessment Tax Assessment Total Assessment is a certain percentage of the fair market value that is determined by local assessors to be the total taxable value of land and additions on the property. | Land | Improvement |
|---|---|---|---|---|
| 2025 | $3,104 | $184,200 | $10,400 | $173,800 |
| 2024 | $2,994 | $184,200 | $10,400 | $173,800 |
| 2023 | $2,994 | $141,900 | $10,400 | $131,500 |
| 2022 | $2,986 | $139,900 | $8,400 | $131,500 |
| 2021 | $2,961 | $139,900 | $8,400 | $131,500 |
| 2020 | $2,456 | $114,700 | $12,500 | $102,200 |
| 2019 | $2,463 | $114,700 | $12,500 | $102,200 |
| 2018 | $2,692 | $125,200 | $12,500 | $112,700 |
| 2017 | $2,066 | $95,600 | $4,900 | $90,700 |
| 2016 | $2,051 | $95,600 | $4,900 | $90,700 |
Source: Public Records
Map
Nearby Homes
- 2816 Monroe St
- 2705 Emiline St
- 2623 Z St
- 2822 Josephine St
- 7005 Chandler Hills Dr
- 2146 Polk St
- 5824 S 31st St
- 7208 Chandler Hills Dr
- 3416 Monroe St
- 2805 Lillian St
- 2333 Olive St
- 3528 Madison St
- 3547 Drexel St
- 2612 Chandler Rd W
- 7514 Chandler Hills Dr
- 5641 S 22nd St
- 3410 U St
- 2529 Mose Ave Unit 9A
- 3613 Emiline St
- 5425 S 23rd St
Your Personal Tour Guide
Ask me questions while you tour the home.