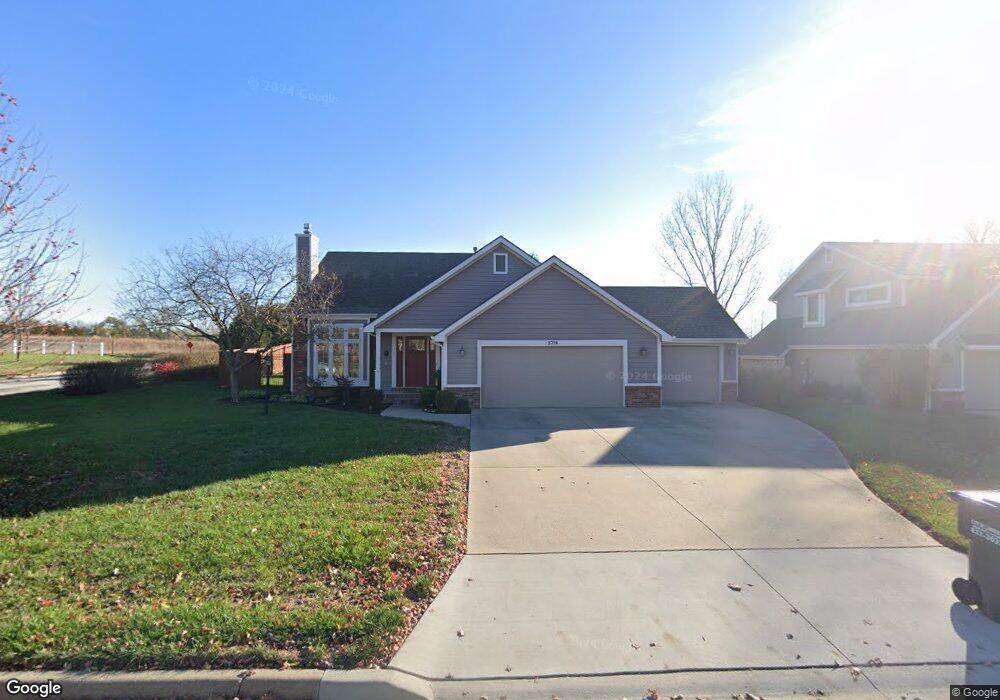
2716 Inverness Ct Lawrence, KS 66047
Estimated Value: $380,000 - $416,000
3
Beds
3
Baths
1,827
Sq Ft
$215/Sq Ft
Est. Value
About This Home
This home is located at 2716 Inverness Ct, Lawrence, KS 66047 and is currently estimated at $392,992, approximately $215 per square foot. 2716 Inverness Ct is a home located in Douglas County with nearby schools including Sunflower Elementary School, Southwest Middle School, and Lawrence High School.
Ownership History
Date
Name
Owned For
Owner Type
Purchase Details
Closed on
May 21, 2008
Sold by
Schulstrom Steven Carl and Schulstrom Christine Ann Byerley
Bought by
Cobb John W and Cobb Candace M
Current Estimated Value
Home Financials for this Owner
Home Financials are based on the most recent Mortgage that was taken out on this home.
Original Mortgage
$172,000
Outstanding Balance
$110,004
Interest Rate
6.07%
Mortgage Type
New Conventional
Estimated Equity
$282,988
Purchase Details
Closed on
Apr 22, 2003
Sold by
Aust Carol J
Bought by
Schulstrom Steven Carl and Schulstrom Christine Ann Byerley
Home Financials for this Owner
Home Financials are based on the most recent Mortgage that was taken out on this home.
Original Mortgage
$189,952
Interest Rate
5.57%
Mortgage Type
Purchase Money Mortgage
Create a Home Valuation Report for This Property
The Home Valuation Report is an in-depth analysis detailing your home's value as well as a comparison with similar homes in the area
Home Values in the Area
Average Home Value in this Area
Purchase History
| Date | Buyer | Sale Price | Title Company |
|---|---|---|---|
| Cobb John W | $215,000 | Kansas Secured Title | |
| Schulstrom Steven Carl | -- | Kansas Secured Title |
Source: Public Records
Mortgage History
| Date | Status | Borrower | Loan Amount |
|---|---|---|---|
| Open | Cobb John W | $172,000 | |
| Closed | Cobb John W | $172,000 | |
| Previous Owner | Schulstrom Steven Carl | $189,952 |
Source: Public Records
Tax History Compared to Growth
Tax History
| Year | Tax Paid | Tax Assessment Tax Assessment Total Assessment is a certain percentage of the fair market value that is determined by local assessors to be the total taxable value of land and additions on the property. | Land | Improvement |
|---|---|---|---|---|
| 2025 | $5,204 | $44,011 | $7,475 | $36,536 |
| 2024 | $5,204 | $41,906 | $7,475 | $34,431 |
| 2023 | $4,870 | $37,881 | $5,520 | $32,361 |
| 2022 | $4,482 | $34,650 | $5,060 | $29,590 |
| 2021 | $4,011 | $30,041 | $4,830 | $25,211 |
| 2020 | $3,774 | $28,428 | $4,830 | $23,598 |
| 2019 | $3,580 | $27,009 | $4,830 | $22,179 |
| 2018 | $3,311 | $24,829 | $4,600 | $20,229 |
| 2017 | $3,274 | $24,277 | $4,600 | $19,677 |
| 2016 | $3,096 | $23,989 | $5,173 | $18,816 |
| 2015 | $3,048 | $23,621 | $5,173 | $18,448 |
| 2014 | $3,044 | $23,817 | $5,173 | $18,644 |
Source: Public Records
Map
Nearby Homes
- 2615 Red Cedar Dr
- 2513 Scottsdale St
- 4112 Blackjack Oak Dr
- 4400 Gretchen Ct
- 2516 Via Linda Dr
- 4812 Tempe St
- 2429 Via Linda Dr
- 2523 Morningside Dr
- 4312 Wimbledon Dr
- 2109 Riviera Dr
- 2100 Inverness Dr
- 2101 Riviera Dr
- 2009 Riviera Ct
- 3406 W 25th Terrace
- 4206 Nicklaus Dr
- 3307 W 26th St
- 1908 Crossgate Dr
- 3033 Havrone Way
- 2407 Yosemite Dr
- 3009 Atchison Way
- 2720 Inverness Ct
- 2712 Inverness Ct
- 2724 Inverness Ct
- 2721 Inverness Ct
- 2717 Inverness Ct
- 2725 Inverness Ct
- 2708 Inverness Ct
- 2728 Inverness Ct
- 2713 Inverness Ct
- 2729 Inverness Ct
- 2709 Inverness Ct
- 2732 Inverness Ct
- 2733 Inverness Ct
- 2704 Inverness Ct
- 2728 Wildflower Dr
- 2720 Wildflower Dr
- 2705 Inverness Ct
- 2724 Wildflower Dr
- 2732 Wildflower Dr
- 2737 Inverness Ct