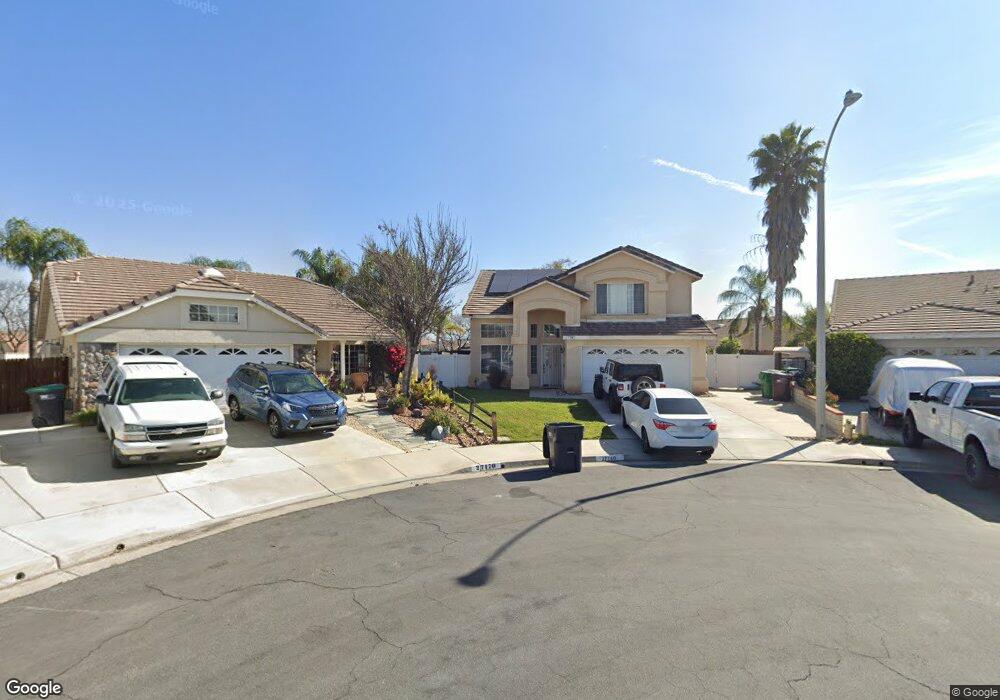
27180 Hemingway Ct Menifee, CA 92584
Paloma Valley NeighborhoodEstimated Value: $589,000 - $622,832
4
Beds
3
Baths
1,963
Sq Ft
$307/Sq Ft
Est. Value
About This Home
This home is located at 27180 Hemingway Ct, Menifee, CA 92584 and is currently estimated at $602,708, approximately $307 per square foot. 27180 Hemingway Ct is a home located in Riverside County with nearby schools including Chester W. Morrison Elementary School, Menifee Valley Middle School, and Pinacate Middle School.
Ownership History
Date
Name
Owned For
Owner Type
Purchase Details
Closed on
Jul 10, 2015
Sold by
Mulvanny Robin and Mulvanny Ryan
Bought by
Mulvanny Robin and Mulvanny Ryan
Current Estimated Value
Home Financials for this Owner
Home Financials are based on the most recent Mortgage that was taken out on this home.
Original Mortgage
$50,000
Interest Rate
4.01%
Mortgage Type
Stand Alone Second
Purchase Details
Closed on
Oct 25, 2006
Sold by
Schaefer Carol J
Bought by
Mulvanny Ryan and Mulvanny Robyn
Home Financials for this Owner
Home Financials are based on the most recent Mortgage that was taken out on this home.
Original Mortgage
$300,000
Outstanding Balance
$257,318
Interest Rate
8.3%
Mortgage Type
Negative Amortization
Estimated Equity
$345,390
Purchase Details
Closed on
Aug 27, 1996
Sold by
Pegg Thomas
Bought by
Schaefer Carol J
Home Financials for this Owner
Home Financials are based on the most recent Mortgage that was taken out on this home.
Original Mortgage
$139,008
Interest Rate
8.23%
Mortgage Type
FHA
Create a Home Valuation Report for This Property
The Home Valuation Report is an in-depth analysis detailing your home's value as well as a comparison with similar homes in the area
Home Values in the Area
Average Home Value in this Area
Purchase History
| Date | Buyer | Sale Price | Title Company |
|---|---|---|---|
| Mulvanny Robin | -- | First American | |
| Mulvanny Ryan | $408,000 | Fidelity Natl Title Ins Co | |
| Schaefer Carol J | $141,500 | First American Title Ins Co |
Source: Public Records
Mortgage History
| Date | Status | Borrower | Loan Amount |
|---|---|---|---|
| Closed | Mulvanny Robin | $50,000 | |
| Open | Mulvanny Ryan | $300,000 | |
| Previous Owner | Schaefer Carol J | $139,008 |
Source: Public Records
Tax History
| Year | Tax Paid | Tax Assessment Tax Assessment Total Assessment is a certain percentage of the fair market value that is determined by local assessors to be the total taxable value of land and additions on the property. | Land | Improvement |
|---|---|---|---|---|
| 2025 | $4,403 | $295,374 | $56,982 | $238,392 |
| 2023 | $4,403 | $283,906 | $54,770 | $229,136 |
| 2022 | $4,368 | $278,341 | $53,697 | $224,644 |
| 2021 | $4,357 | $272,885 | $52,645 | $220,240 |
| 2020 | $4,303 | $270,088 | $52,106 | $217,982 |
| 2019 | $3,737 | $223,793 | $51,085 | $172,708 |
| 2018 | $3,614 | $219,406 | $50,084 | $169,322 |
| 2017 | $3,562 | $215,104 | $49,102 | $166,002 |
| 2016 | $3,477 | $210,888 | $48,140 | $162,748 |
| 2015 | $3,434 | $207,722 | $47,418 | $160,304 |
| 2014 | -- | $203,655 | $46,490 | $157,165 |
Source: Public Records
Map
Nearby Homes
- 30478 Blume Cir
- 30550 Stern Dr
- 30535 Ridgely Way
- 30581 Old Windmill Rd
- 30645 Old Windmill Rd
- 27270 Barre Dr
- 30525 Old Windmill Rd
- 27283 Chase Rd
- 30620 Old Windmill Rd
- 27351 Georgetown Dr
- 30521 Serra Vista Dr
- 30640 Old Windmill Rd
- 30750 Old Windmill Rd
- 26941 Merced St
- 30383 Town Square Dr
- 30923 Lajoe St
- 30701 Sherman Rd
- 27080 Sapphire St
- 30332 Town Square Dr
- 26773 Merced St
- 27170 Hemingway Ct
- 27185 Hemingway Ct
- 30529 Glaspell Ct
- 30519 Glaspell Ct
- 27160 Hemingway Ct
- 27175 Hemingway Ct
- 27150 Hemingway Ct
- 30549 Glaspell Ct
- 27165 Hemingway Ct
- 30488 Blume Cir
- 27155 Hemingway Ct
- 30559 Glaspell Ct
- 30524 Glaspell Ct
- 27202 Fitzgerald Place
- 27140 Hemingway Ct
- 30491 Cleary St
- 27145 Hemingway Ct
- 27192 Fitzgerald Place
- 30473 Blume Cir
- 27172 Fitzgerald Place
Your Personal Tour Guide
Ask me questions while you tour the home.