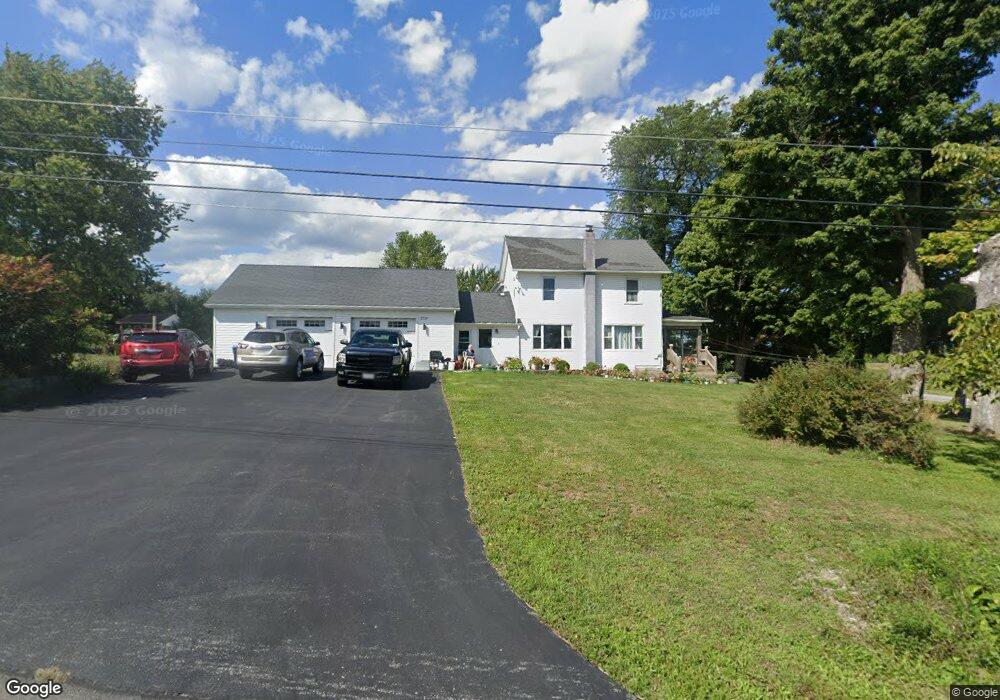
2719 Dow Rd Piffard, NY 14533
Estimated Value: $235,000 - $410,000
4
Beds
4
Baths
3,181
Sq Ft
$93/Sq Ft
Est. Value
About This Home
This home is located at 2719 Dow Rd, Piffard, NY 14533 and is currently estimated at $296,429, approximately $93 per square foot. 2719 Dow Rd is a home located in Livingston County with nearby schools including York Elementary School and York Middle/High School.
Ownership History
Date
Name
Owned For
Owner Type
Purchase Details
Closed on
Mar 27, 2009
Sold by
Us Bank National
Bought by
Webster Randall
Current Estimated Value
Home Financials for this Owner
Home Financials are based on the most recent Mortgage that was taken out on this home.
Original Mortgage
$80,000
Outstanding Balance
$46,458
Interest Rate
5.14%
Mortgage Type
Unknown
Estimated Equity
$249,971
Purchase Details
Closed on
Sep 12, 2008
Sold by
Mann Donald
Bought by
Us Bank National
Purchase Details
Closed on
Jun 27, 1995
Sold by
Woodhull Daniel A Woodhull Mar
Bought by
Germaine Richard L
Create a Home Valuation Report for This Property
The Home Valuation Report is an in-depth analysis detailing your home's value as well as a comparison with similar homes in the area
Home Values in the Area
Average Home Value in this Area
Purchase History
| Date | Buyer | Sale Price | Title Company |
|---|---|---|---|
| Webster Randall | $100,000 | -- | |
| Us Bank National | $105,000 | -- | |
| Germaine Richard L | $128,865 | -- |
Source: Public Records
Mortgage History
| Date | Status | Borrower | Loan Amount |
|---|---|---|---|
| Open | Webster Randall | $80,000 |
Source: Public Records
Tax History
| Year | Tax Paid | Tax Assessment Tax Assessment Total Assessment is a certain percentage of the fair market value that is determined by local assessors to be the total taxable value of land and additions on the property. | Land | Improvement |
|---|---|---|---|---|
| 2024 | $5,045 | $167,300 | $19,500 | $147,800 |
| 2023 | $4,483 | $167,300 | $19,500 | $147,800 |
| 2022 | $4,748 | $167,300 | $19,500 | $147,800 |
| 2021 | $4,648 | $128,500 | $26,000 | $102,500 |
| 2020 | $4,135 | $128,500 | $26,000 | $102,500 |
| 2019 | $4,551 | $128,500 | $26,000 | $102,500 |
| 2018 | $4,551 | $128,500 | $26,000 | $102,500 |
| 2017 | $4,840 | $123,800 | $26,000 | $97,800 |
| 2016 | $4,603 | $123,800 | $26,000 | $97,800 |
| 2015 | -- | $115,800 | $26,000 | $89,800 |
| 2014 | -- | $115,800 | $26,000 | $89,800 |
Source: Public Records
Map
Nearby Homes
- 2385 Dow Rd
- 2513 Genesee St
- 2709 Chestnut St
- 0 Dow Rd Unit R1652163
- 2572 Cowan Rd
- 0 Cowan Rd
- 1950 Dow Rd
- 2245 Milroy Rd
- 4540 York Rd
- 3237 Fowlerville Rd
- 12 Cavalry Rd
- 32 North St
- 2699 James Way
- 66 2nd St
- 72 2nd St
- 67 Center St
- 20 Prospect St
- 8121 Telephone Rd
- 0 Volunteer Rd Unit R1658263
- 7665 Telephone Rd
Your Personal Tour Guide
Ask me questions while you tour the home.