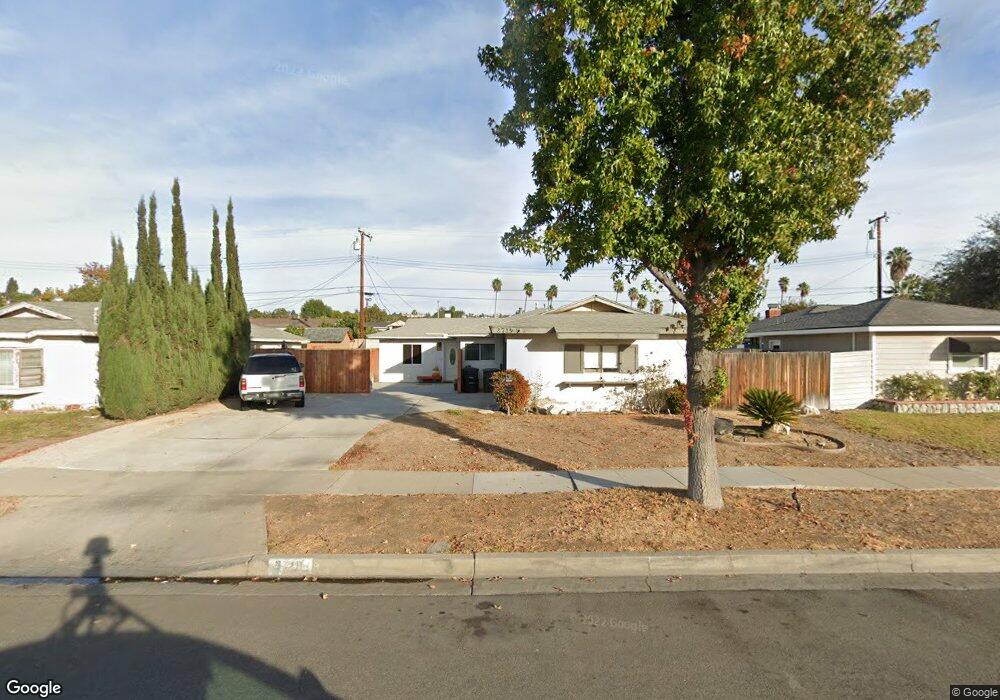
2719 N Anchor St Orange, CA 92865
Estimated Value: $1,056,533 - $1,193,000
3
Beds
2
Baths
1,843
Sq Ft
$596/Sq Ft
Est. Value
About This Home
This home is located at 2719 N Anchor St, Orange, CA 92865 and is currently estimated at $1,098,633, approximately $596 per square foot. 2719 N Anchor St is a home located in Orange County with nearby schools including Olive Elementary School, Cerro Villa Middle School, and Villa Park High School.
Ownership History
Date
Name
Owned For
Owner Type
Purchase Details
Closed on
Jun 19, 2002
Sold by
Biletski Edward and Biletsky Geneva L
Bought by
Billante Sean K and Billante Kellie A
Current Estimated Value
Home Financials for this Owner
Home Financials are based on the most recent Mortgage that was taken out on this home.
Original Mortgage
$291,000
Interest Rate
6.69%
Purchase Details
Closed on
Apr 9, 2001
Sold by
Biletski Edward and Biletski Geneva
Bought by
Biletski Edward and Biletski Geneva L
Home Financials for this Owner
Home Financials are based on the most recent Mortgage that was taken out on this home.
Original Mortgage
$241,000
Interest Rate
6.62%
Create a Home Valuation Report for This Property
The Home Valuation Report is an in-depth analysis detailing your home's value as well as a comparison with similar homes in the area
Home Values in the Area
Average Home Value in this Area
Purchase History
| Date | Buyer | Sale Price | Title Company |
|---|---|---|---|
| Billante Sean K | -- | Chicago Title Insurance Comp | |
| Biletski Edward | -- | California Counties Title Co |
Source: Public Records
Mortgage History
| Date | Status | Borrower | Loan Amount |
|---|---|---|---|
| Closed | Billante Sean K | $291,000 | |
| Closed | Biletski Edward | $241,000 |
Source: Public Records
Tax History
| Year | Tax Paid | Tax Assessment Tax Assessment Total Assessment is a certain percentage of the fair market value that is determined by local assessors to be the total taxable value of land and additions on the property. | Land | Improvement |
|---|---|---|---|---|
| 2025 | $1,152 | $73,336 | $29,158 | $44,178 |
| 2024 | $1,152 | $71,899 | $28,587 | $43,312 |
| 2023 | $1,123 | $70,490 | $28,027 | $42,463 |
| 2022 | $1,097 | $69,108 | $27,477 | $41,631 |
| 2021 | $1,072 | $67,753 | $26,938 | $40,815 |
| 2020 | $1,061 | $67,059 | $26,662 | $40,397 |
| 2019 | $1,052 | $65,745 | $26,140 | $39,605 |
| 2018 | $1,037 | $64,456 | $25,627 | $38,829 |
| 2017 | $1,003 | $63,193 | $25,125 | $38,068 |
| 2016 | $986 | $61,954 | $24,632 | $37,322 |
| 2015 | $971 | $61,024 | $24,262 | $36,762 |
| 2014 | $951 | $59,829 | $23,787 | $36,042 |
Source: Public Records
Map
Nearby Homes
- 2620 N Dunbar St
- 1201 E Saint James Ave
- 2680 N Canal St
- 1248 E Saint James Ave
- 1226 E Ensign Cir
- 8641 N Orange Olive Rd
- 16591 E Buena Vista Ave
- 2504 N Bourbon St
- 2525 N Bourbon St Unit T4
- 3029 N Cottonwood St Unit 12
- 2496 N Beechwood St
- 2850 N Glassell St
- 1119 E Cumberland Rd
- 1800 E Heim Ave Unit 48
- 1800 E Heim Ave Unit 29
- 506 W Linden Dr
- 410 W Crystal View Ave
- 2078 E Nohl Ranch Rd
- 2295 N Tustin St Unit 31
- 3110 N Sunrise Ct
- 2709 N Anchor St
- 2731 N Anchor St
- 2720 N Galley St
- 2732 N Galley St
- 2710 N Galley St
- 2741 N Anchor St
- 2701 N Anchor St
- 2716 N Anchor St
- 2728 N Anchor St
- 2742 N Galley St
- 2702 N Galley St
- 2706 N Anchor St
- 2738 N Anchor St
- 0 N St Unit OC15033111
- 2753 N Anchor St
- 2689 N Anchor St
- 2696 N Anchor St
- 2692 N Galley St
- 2754 N Galley St
- 2696 N Anchor Ave
Your Personal Tour Guide
Ask me questions while you tour the home.