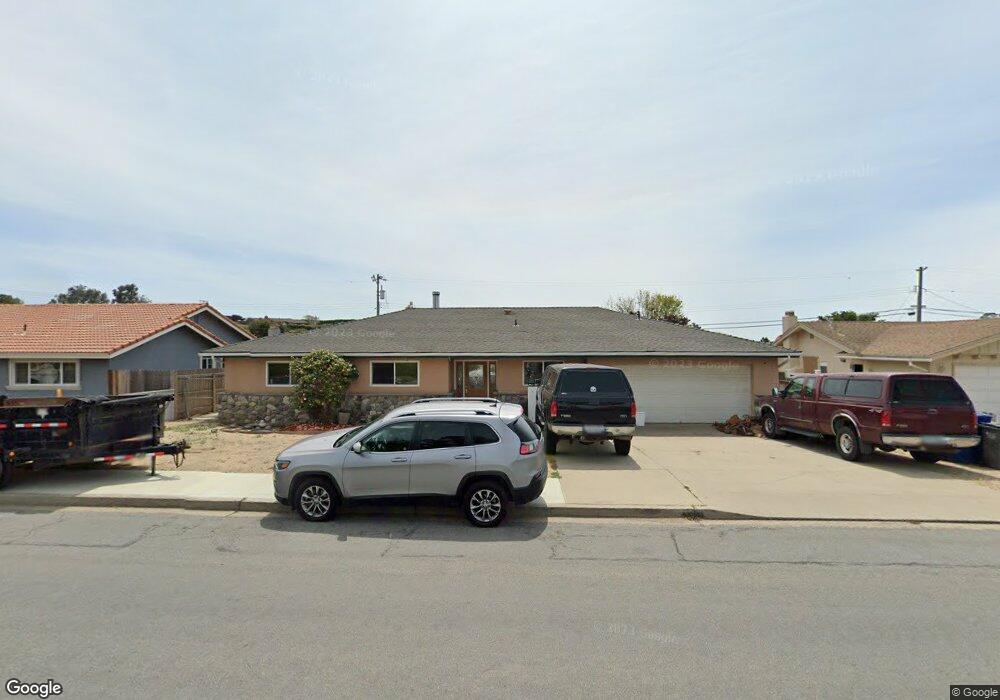
2719 S Halcyon Rd Arroyo Grande, CA 93420
Estimated Value: $851,479 - $1,091,000
3
Beds
2
Baths
1,500
Sq Ft
$617/Sq Ft
Est. Value
About This Home
This home is located at 2719 S Halcyon Rd, Arroyo Grande, CA 93420 and is currently estimated at $925,870, approximately $617 per square foot. 2719 S Halcyon Rd is a home located in San Luis Obispo County with nearby schools including Oceano Elementary School, Mesa Middle School, and Nipomo High School.
Ownership History
Date
Name
Owned For
Owner Type
Purchase Details
Closed on
May 26, 2009
Sold by
Bedford David
Bought by
Bedford David G
Current Estimated Value
Home Financials for this Owner
Home Financials are based on the most recent Mortgage that was taken out on this home.
Original Mortgage
$199,000
Outstanding Balance
$53,017
Interest Rate
4.78%
Mortgage Type
New Conventional
Estimated Equity
$872,853
Purchase Details
Closed on
Jun 7, 2000
Sold by
Pischke Michael J
Bought by
Bedford David
Home Financials for this Owner
Home Financials are based on the most recent Mortgage that was taken out on this home.
Original Mortgage
$174,750
Interest Rate
8.67%
Purchase Details
Closed on
Nov 5, 1999
Sold by
Pischke Michael
Bought by
Pischke Michael J
Home Financials for this Owner
Home Financials are based on the most recent Mortgage that was taken out on this home.
Original Mortgage
$183,200
Interest Rate
7.84%
Purchase Details
Closed on
Dec 21, 1993
Sold by
Pischke Holly
Bought by
Pischke Michael
Create a Home Valuation Report for This Property
The Home Valuation Report is an in-depth analysis detailing your home's value as well as a comparison with similar homes in the area
Home Values in the Area
Average Home Value in this Area
Purchase History
| Date | Buyer | Sale Price | Title Company |
|---|---|---|---|
| Bedford David G | -- | First American Title Company | |
| Bedford David | $233,000 | Fidelity National Title Co | |
| Pischke Michael J | -- | First American | |
| Pischke Michael | -- | -- |
Source: Public Records
Mortgage History
| Date | Status | Borrower | Loan Amount |
|---|---|---|---|
| Open | Bedford David G | $199,000 | |
| Closed | Bedford David | $174,750 | |
| Previous Owner | Pischke Michael J | $183,200 |
Source: Public Records
Tax History Compared to Growth
Tax History
| Year | Tax Paid | Tax Assessment Tax Assessment Total Assessment is a certain percentage of the fair market value that is determined by local assessors to be the total taxable value of land and additions on the property. | Land | Improvement |
|---|---|---|---|---|
| 2025 | $3,538 | $351,069 | $120,536 | $230,533 |
| 2024 | $3,496 | $344,186 | $118,173 | $226,013 |
| 2023 | $3,496 | $337,438 | $115,856 | $221,582 |
| 2022 | $3,441 | $330,823 | $113,585 | $217,238 |
| 2021 | $3,434 | $324,337 | $111,358 | $212,979 |
| 2020 | $3,394 | $321,013 | $110,217 | $210,796 |
| 2019 | $3,371 | $314,719 | $108,056 | $206,663 |
| 2018 | $3,330 | $308,549 | $105,938 | $202,611 |
| 2017 | $3,266 | $302,500 | $103,861 | $198,639 |
| 2016 | $3,079 | $296,570 | $101,825 | $194,745 |
| 2015 | $3,033 | $292,116 | $100,296 | $191,820 |
| 2014 | $2,920 | $286,395 | $98,332 | $188,063 |
Source: Public Records
Map
Nearby Homes
- 765 Mesa View Dr Unit 172
- 765 Mesa View Dr Unit 86
- 765 Mesa View Dr Unit 290
- 765 Mesa View Dr
- 765 Mesa View Dr Unit 265
- 765 Mesa View Dr Unit 196
- 585 Redtail Meadow Ln
- 2535 Appaloosa Way
- 2610 Bayside Place
- 765 Mesa Dunes
- 2303 Sanderling Ct
- 2275 Plover Ct
- 740 Avocet Way
- 821 Chukar St
- 824 Jacana Ct
- 175 Michael Ln
- 2700 Cienaga St Unit 8
- 2085 Westhampton Dr
- 42 Cienaga St
- 117 W El Campo Rd
- 2727 S Halcyon Rd
- 2711 S Halcyon Rd
- 2726 Brisa Blanda Dr
- 2716 Brisa Blanda Dr
- 2734 Brisa Blanda Dr
- 2701 S Halcyon Rd
- 2735 S Halcyon Rd
- 2708 Brisa Blanda Dr
- 2742 Brisa Blanda Dr
- 2743 S Halcyon Rd
- 608 Camino Contento
- 545 Cameo Way
- 2752 Brisa Blanda Dr
- 2700 Brisa Blanda Dr
- 2729 Brisa Blanda Dr
- 2717 Brisa Blanda Dr
- 2737 Brisa Blanda Dr
- 2745 Brisa Blanda Dr
- 650 Camino Contento
- 2760 Brisa Blanda Dr