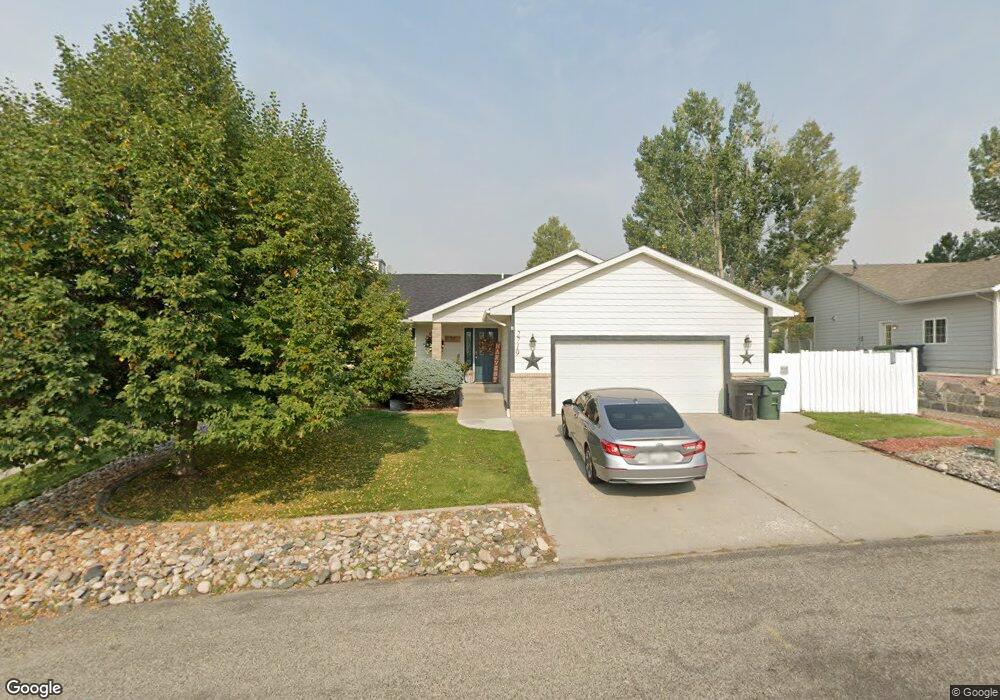
2719 Troon Cir Billings, MT 59101
Estimated Value: $490,000 - $531,000
3
Beds
3
Baths
3,168
Sq Ft
$163/Sq Ft
Est. Value
About This Home
This home is located at 2719 Troon Cir, Billings, MT 59101 and is currently estimated at $515,687, approximately $162 per square foot. 2719 Troon Cir is a home located in Yellowstone County with nearby schools including Blue Creek School, Riverside Junior High School, and Billings Senior High School.
Ownership History
Date
Name
Owned For
Owner Type
Purchase Details
Closed on
May 4, 2018
Sold by
Fnma
Bought by
Mullenberg Derek
Current Estimated Value
Home Financials for this Owner
Home Financials are based on the most recent Mortgage that was taken out on this home.
Original Mortgage
$235,554
Outstanding Balance
$202,820
Interest Rate
4.4%
Mortgage Type
Stand Alone Refi Refinance Of Original Loan
Estimated Equity
$312,867
Purchase Details
Closed on
Jul 19, 2017
Sold by
Noenning Mrk E
Bought by
Federal National Mortgage Association
Purchase Details
Closed on
May 25, 2010
Sold by
Lensing Thad Blake and Bauwens Nichole Marie
Bought by
Lensing Thad B and Lensing Nichole M
Home Financials for this Owner
Home Financials are based on the most recent Mortgage that was taken out on this home.
Original Mortgage
$276,279
Interest Rate
4.5%
Mortgage Type
FHA
Create a Home Valuation Report for This Property
The Home Valuation Report is an in-depth analysis detailing your home's value as well as a comparison with similar homes in the area
Home Values in the Area
Average Home Value in this Area
Purchase History
| Date | Buyer | Sale Price | Title Company |
|---|---|---|---|
| Mullenberg Derek | $239,900 | -- | |
| Federal National Mortgage Association | -- | American Title & Escrow | |
| Lensing Thad B | -- | None Available | |
| Lensing Thad Blake | -- | None Available |
Source: Public Records
Mortgage History
| Date | Status | Borrower | Loan Amount |
|---|---|---|---|
| Open | Mullenberg Derek | $235,554 | |
| Previous Owner | Lensing Thad Blake | $276,279 |
Source: Public Records
Tax History Compared to Growth
Tax History
| Year | Tax Paid | Tax Assessment Tax Assessment Total Assessment is a certain percentage of the fair market value that is determined by local assessors to be the total taxable value of land and additions on the property. | Land | Improvement |
|---|---|---|---|---|
| 2025 | $3,698 | $479,600 | $78,773 | $400,827 |
| 2024 | $3,698 | $418,400 | $118,758 | $299,642 |
| 2023 | $4,049 | $449,300 | $160,324 | $288,976 |
| 2022 | $3,748 | $372,800 | $0 | $0 |
| 2021 | $3,558 | $372,800 | $0 | $0 |
| 2020 | $3,391 | $343,300 | $0 | $0 |
| 2019 | $3,277 | $343,300 | $0 | $0 |
| 2018 | $2,884 | $301,900 | $0 | $0 |
| 2017 | $2,828 | $301,900 | $0 | $0 |
| 2016 | $2,698 | $295,600 | $0 | $0 |
| 2015 | $2,599 | $295,600 | $0 | $0 |
| 2014 | $2,540 | $149,407 | $0 | $0 |
Source: Public Records
Map
Nearby Homes
- 2604 Castle Pines Dr
- 3442 Castle Pines Dr
- 3335 Mcmasters Rd
- 3525 Prestwick Rd
- 3155 Mcmasters Rd
- 3041 Kincaid Rd
- 3509 Mac Duff Cir
- 2315 Glengarry Ln
- 2318 Glengarry Ln
- BCA Lot 3 Shaia Way
- BCA Lot 4 Shaia Way
- 2914 Kincaid Rd
- 3205 Deer Pass Trail
- 1811 Briarwood Blvd
- 0 Colleen Dr
- 3992 Vista View Rd
- 3748 Blue Creek Rd
- 3947 Blue Creek Rd
- 1873 Weldon Rd
- 3831 Yorkshire Ct N
- 2725 Troon Cir
- 2713 Troon Cir
- 0 Troon Cir
- 2724 Troon Cir
- 2731 Troon Cir
- 2718 Troon Cir
- 2737 Troon Cir
- 2730 Troon Cir
- 2704 Troon Cir
- 2712 Troon Cir
- 2736 Troon Cir
- 3339 John O Groats Ct
- 2708 Troon Cir
- 2743 Troon Cir
- 3335 John O Groats Ct
- 3338 John O Groats Ct
- 3329 John O Groats Ct
- 3334 John O Groats Ct
- 3349 Prestwick Rd
- 3405 Prestwick Rd