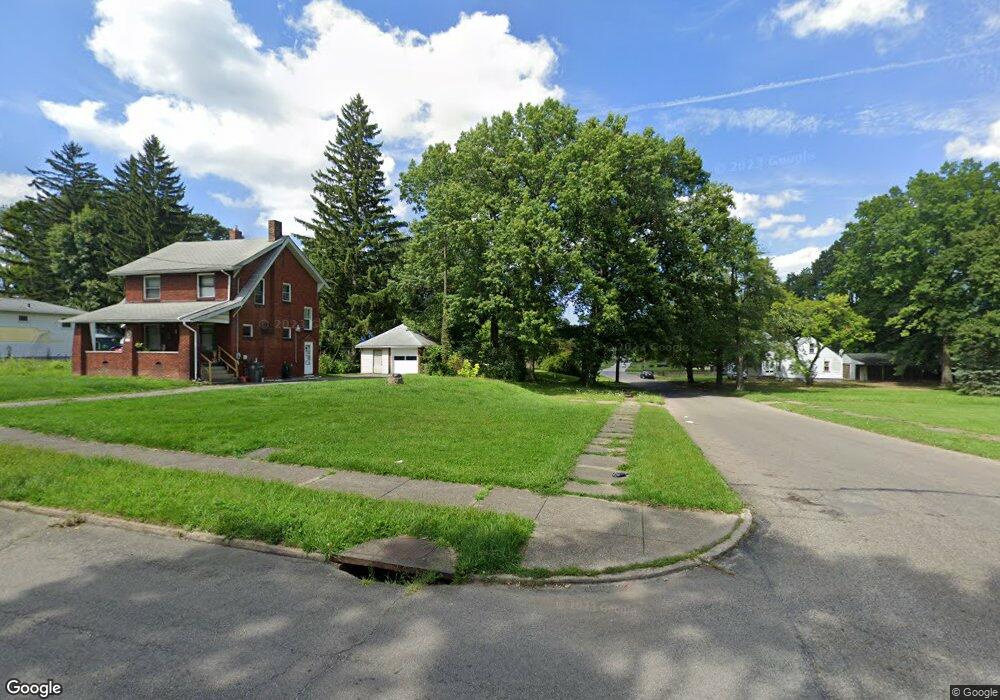
272 E Avondale Ave Youngstown, OH 44507
Cottage Grove NeighborhoodEstimated Value: $23,266 - $138,000
5
Beds
2
Baths
2,693
Sq Ft
$35/Sq Ft
Est. Value
About This Home
This home is located at 272 E Avondale Ave, Youngstown, OH 44507 and is currently estimated at $93,317, approximately $34 per square foot. 272 E Avondale Ave is a home located in Mahoning County with nearby schools including Taft Elementary School, East High School, and Horizon Science Academy - Youngstown.
Ownership History
Date
Name
Owned For
Owner Type
Purchase Details
Closed on
May 12, 2008
Sold by
Jab Investments Inc
Bought by
Ragland Falesia I
Current Estimated Value
Purchase Details
Closed on
Mar 28, 2008
Sold by
Wells Fargo Bank Na
Bought by
Jab Investments Inc
Purchase Details
Closed on
Mar 9, 2007
Sold by
Tubbs Michael and Tubbs Yolanda
Bought by
Wells Fargo Bank Na and Certificate Holders Park Place Securitie
Purchase Details
Closed on
Apr 28, 2005
Sold by
Warren Emmett
Bought by
Tubbs Michael and Tubbs Yolanda
Home Financials for this Owner
Home Financials are based on the most recent Mortgage that was taken out on this home.
Original Mortgage
$56,100
Interest Rate
8.75%
Mortgage Type
Fannie Mae Freddie Mac
Purchase Details
Closed on
May 5, 2000
Sold by
Parker Will E and Parker Rose M
Bought by
Warren Emmett
Purchase Details
Closed on
Mar 30, 1999
Sold by
Pegues Francine
Bought by
Hollis Judith
Purchase Details
Closed on
May 10, 1989
Bought by
Pegues Francine
Create a Home Valuation Report for This Property
The Home Valuation Report is an in-depth analysis detailing your home's value as well as a comparison with similar homes in the area
Home Values in the Area
Average Home Value in this Area
Purchase History
| Date | Buyer | Sale Price | Title Company |
|---|---|---|---|
| Ragland Falesia I | $10,900 | Attorney | |
| Jab Investments Inc | $6,000 | Attorney | |
| Wells Fargo Bank Na | $18,000 | None Available | |
| Tubbs Michael | $66,000 | Reliable Title | |
| Warren Emmett | $1,588 | -- | |
| Hollis Judith | $5,500 | -- | |
| Pegues Francine | $31,500 | -- |
Source: Public Records
Mortgage History
| Date | Status | Borrower | Loan Amount |
|---|---|---|---|
| Previous Owner | Tubbs Michael | $56,100 | |
| Closed | Tubbs Michael | $6,600 |
Source: Public Records
Tax History Compared to Growth
Tax History
| Year | Tax Paid | Tax Assessment Tax Assessment Total Assessment is a certain percentage of the fair market value that is determined by local assessors to be the total taxable value of land and additions on the property. | Land | Improvement |
|---|---|---|---|---|
| 2024 | $12 | $240 | $240 | -- |
| 2023 | $12 | $240 | $240 | $0 |
| 2022 | $16 | $260 | $260 | $0 |
| 2021 | $16 | $260 | $260 | $0 |
| 2020 | $16 | $260 | $260 | $0 |
| 2019 | $317 | $240 | $240 | $0 |
| 2018 | $317 | $240 | $240 | $0 |
| 2017 | $167 | $240 | $240 | $0 |
| 2016 | $166 | $240 | $240 | $0 |
| 2015 | $15 | $240 | $240 | $0 |
| 2014 | $15 | $240 | $240 | $0 |
| 2013 | $227 | $3,540 | $800 | $2,740 |
Source: Public Records
Map
Nearby Homes
- 207 E Lucius Ave
- 358 E Auburndale Ave
- 182 E Auburndale Ave
- 144 Brooklyn Ave
- 161 E Auburndale Ave
- 123 E Boston Ave
- 131 E Ravenwood Ave Unit 133
- 537 Cambridge Ave
- 524 E Philadelphia Ave
- 371 Potomac Ave
- 116 Hilton Ave
- 2740 South Ave
- 3726 Sunset Blvd
- 582 Roxbury Ave
- 365 E Midlothian Blvd
- 230 Clarencedale Ave
- 188 Clarencedale Ave
- 703 E Judson Ave
- 3930 Sunset Dr
- 805 E Boston Ave
- 268 E Avondale Ave
- 262 E Avondale Ave
- 304 E Avondale Ave
- 260 E Avondale Ave
- 3124 Rush Blvd
- 308 E Avondale Ave
- 3121 Rush Blvd
- 258 E Avondale Ave
- 275 E Avondale Ave
- 271 E Avondale Ave
- 314 E Avondale Ave
- 3116 Rush Blvd
- 267 E Avondale Ave
- 256 E Avondale Ave
- 263 E Avondale Ave
- 307 E Avondale Ave
- 318 E Avondale Ave
- 3115 Rush Blvd
- 3112 Rush Blvd
- 254 E Avondale Ave