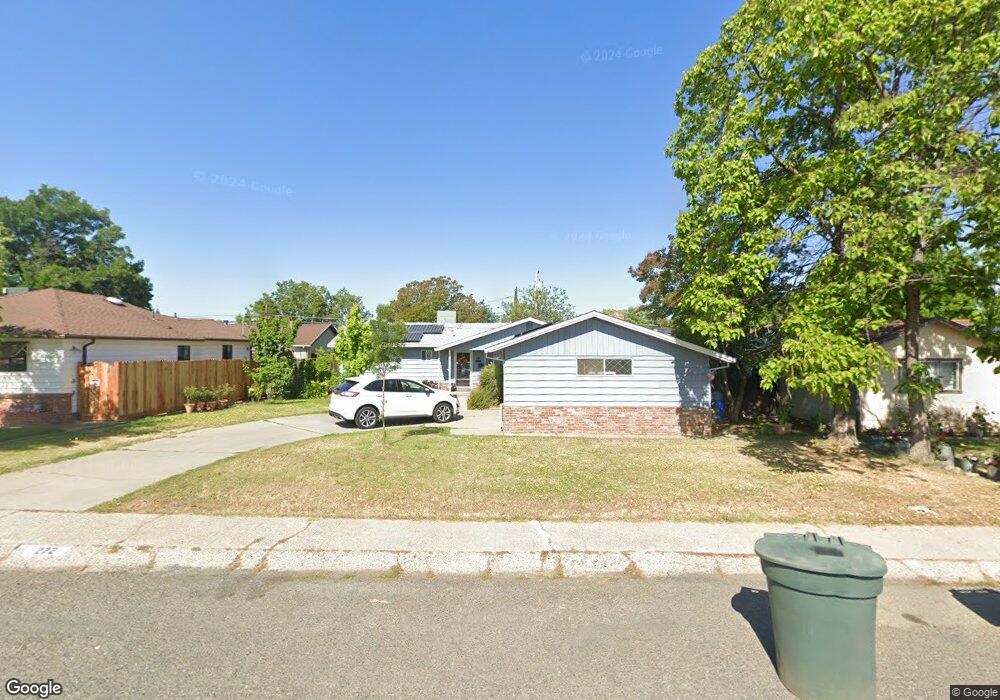
272 I St Lincoln, CA 95648
Estimated Value: $406,000 - $451,924
3
Beds
1
Bath
1,347
Sq Ft
$317/Sq Ft
Est. Value
About This Home
This home is located at 272 I St, Lincoln, CA 95648 and is currently estimated at $427,231, approximately $317 per square foot. 272 I St is a home located in Placer County with nearby schools including First Street, Glen Edwards Middle, and Lincoln High.
Ownership History
Date
Name
Owned For
Owner Type
Purchase Details
Closed on
Aug 25, 2025
Sold by
Bowen Tanya L
Bought by
Roberts Landon Wayne and Mitchell Emily
Current Estimated Value
Home Financials for this Owner
Home Financials are based on the most recent Mortgage that was taken out on this home.
Original Mortgage
$384,750
Outstanding Balance
$384,750
Interest Rate
6.75%
Mortgage Type
New Conventional
Estimated Equity
$42,481
Purchase Details
Closed on
Oct 27, 2011
Sold by
Spencer Sharon
Bought by
Spencer Sharon R
Purchase Details
Closed on
Oct 14, 2004
Sold by
Spencer David G and Spencer Sharon R
Bought by
Spencer Sharon
Home Financials for this Owner
Home Financials are based on the most recent Mortgage that was taken out on this home.
Original Mortgage
$120,000
Interest Rate
5.82%
Mortgage Type
Stand Alone Refi Refinance Of Original Loan
Create a Home Valuation Report for This Property
The Home Valuation Report is an in-depth analysis detailing your home's value as well as a comparison with similar homes in the area
Home Values in the Area
Average Home Value in this Area
Purchase History
| Date | Buyer | Sale Price | Title Company |
|---|---|---|---|
| Roberts Landon Wayne | $405,000 | Chicago Title | |
| Spencer Sharon R | -- | None Available | |
| Spencer Sharon | -- | North American Title |
Source: Public Records
Mortgage History
| Date | Status | Borrower | Loan Amount |
|---|---|---|---|
| Open | Roberts Landon Wayne | $384,750 | |
| Previous Owner | Spencer Sharon | $120,000 | |
| Closed | Spencer Sharon | $30,000 |
Source: Public Records
Tax History
| Year | Tax Paid | Tax Assessment Tax Assessment Total Assessment is a certain percentage of the fair market value that is determined by local assessors to be the total taxable value of land and additions on the property. | Land | Improvement |
|---|---|---|---|---|
| 2025 | $1,499 | $149,258 | $30,449 | $118,809 |
| 2023 | $1,499 | $143,464 | $29,267 | $114,197 |
| 2022 | $1,453 | $140,652 | $28,694 | $111,958 |
| 2021 | $1,423 | $137,895 | $28,132 | $109,763 |
| 2020 | $1,415 | $136,482 | $27,844 | $108,638 |
| 2019 | $1,376 | $133,807 | $27,299 | $106,508 |
| 2018 | $1,341 | $131,184 | $26,764 | $104,420 |
| 2017 | $1,297 | $128,613 | $26,240 | $102,373 |
| 2016 | $1,264 | $126,092 | $25,726 | $100,366 |
| 2015 | $1,236 | $124,199 | $25,340 | $98,859 |
| 2014 | $1,202 | $121,767 | $24,844 | $96,923 |
Source: Public Records
Map
Nearby Homes
- 908 Hollingsworth Ct
- 394 Lincoln Blvd
- 1101 First St
- 1259 Shirley Way
- 530 5th St
- 116 Crystalwood Way
- 28 Crystalwood Cir
- 0 5th St
- 654 B St
- 2730 Bedell St
- 301 Falkirk Ct
- 961 Silverton Cir
- 110 Northfield Ct
- 149 E 5th St
- 622 Q St
- 561 Rustic Ranch Ln
- 679 Wagon Wheel Ln
- 1743 Laehr Dr
- 1822 4th St
- 608 Wagon Wheel Ln
Your Personal Tour Guide
Ask me questions while you tour the home.