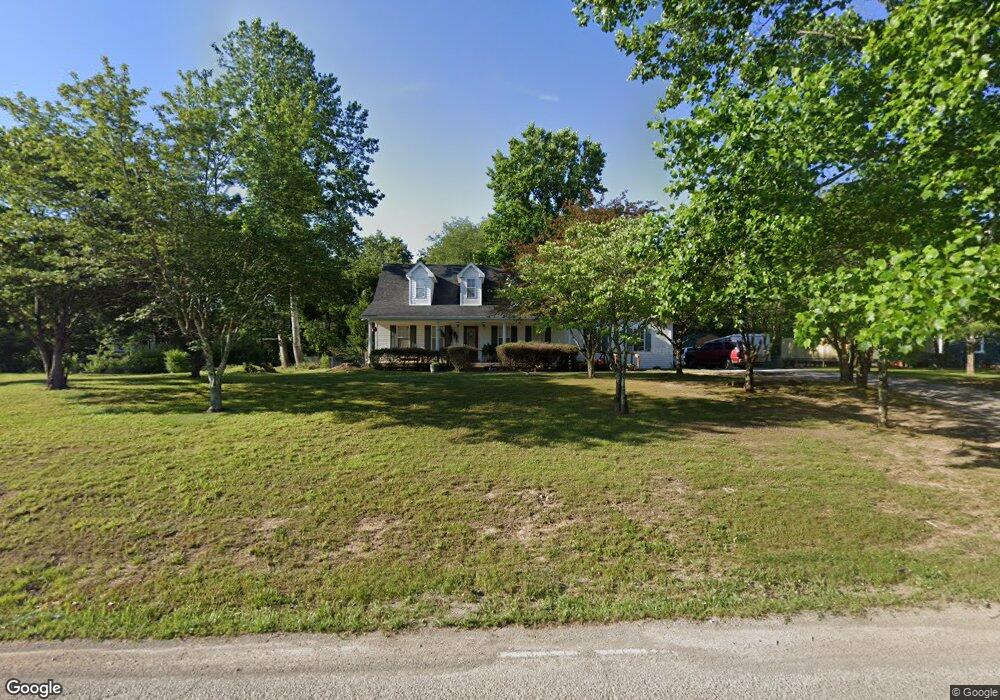
272 Murrell Rd Dickson, TN 37055
Estimated Value: $342,333 - $477,000
Studio
2
Baths
2,169
Sq Ft
$193/Sq Ft
Est. Value
About This Home
This home is located at 272 Murrell Rd, Dickson, TN 37055 and is currently estimated at $418,333, approximately $192 per square foot. 272 Murrell Rd is a home located in Dickson County with nearby schools including Oakmont Elementary School, Burns Middle School, and Dickson County High School.
Ownership History
Date
Name
Owned For
Owner Type
Purchase Details
Closed on
Jun 23, 2011
Sold by
Secretary Of Housing And U
Bought by
Newberry Teresa L
Current Estimated Value
Home Financials for this Owner
Home Financials are based on the most recent Mortgage that was taken out on this home.
Original Mortgage
$137,981
Outstanding Balance
$98,909
Interest Rate
5.5%
Mortgage Type
FHA
Estimated Equity
$319,424
Purchase Details
Closed on
Aug 3, 2010
Sold by
Farmer Christopher E
Bought by
Secretary Of Housing
Purchase Details
Closed on
Jul 18, 2001
Sold by
Robinson Sandra
Bought by
Farmer Christopher and Farmer Melin
Home Financials for this Owner
Home Financials are based on the most recent Mortgage that was taken out on this home.
Original Mortgage
$162,352
Interest Rate
7.08%
Purchase Details
Closed on
May 30, 2000
Sold by
Kruse Willard E
Bought by
Robonson Sandra
Purchase Details
Closed on
Mar 23, 2000
Bought by
Robinson Sandra
Purchase Details
Closed on
Nov 29, 1965
Bought by
Kruse Willard E
Create a Home Valuation Report for This Property
The Home Valuation Report is an in-depth analysis detailing your home's value as well as a comparison with similar homes in the area
Home Values in the Area
Average Home Value in this Area
Purchase History
| Date | Buyer | Sale Price | Title Company |
|---|---|---|---|
| Newberry Teresa L | $136,000 | -- | |
| Secretary Of Housing | $166,584 | -- | |
| Farmer Christopher | $164,900 | -- | |
| Robonson Sandra | $18,000 | -- | |
| Robinson Sandra | $18,000 | -- | |
| Kruse Willard E | -- | -- |
Source: Public Records
Mortgage History
| Date | Status | Borrower | Loan Amount |
|---|---|---|---|
| Open | Newberry Teresa L | $137,981 | |
| Previous Owner | Kruse Willard E | $162,352 |
Source: Public Records
Tax History
| Year | Tax Paid | Tax Assessment Tax Assessment Total Assessment is a certain percentage of the fair market value that is determined by local assessors to be the total taxable value of land and additions on the property. | Land | Improvement |
|---|---|---|---|---|
| 2025 | $981 | $58,050 | $10,475 | $47,575 |
| 2024 | $981 | $58,050 | $10,475 | $47,575 |
| 2023 | $1,046 | $44,500 | $7,925 | $36,575 |
| 2022 | $1,046 | $44,500 | $7,925 | $36,575 |
| 2021 | $1,554 | $44,500 | $7,925 | $36,575 |
| 2020 | $1,554 | $66,125 | $7,925 | $58,200 |
| 2019 | $1,554 | $66,125 | $7,925 | $58,200 |
| 2018 | $1,383 | $51,225 | $4,250 | $46,975 |
| 2017 | $1,383 | $51,225 | $4,250 | $46,975 |
| 2016 | $1,383 | $51,225 | $4,250 | $46,975 |
| 2015 | $1,259 | $43,400 | $4,250 | $39,150 |
| 2014 | $1,259 | $43,400 | $4,250 | $39,150 |
Source: Public Records
Map
Nearby Homes
- 1024 E Piney Rd
- 151 Covington Ln
- 0 Cowan Rd Unit RTC3135943
- 1000 Sendero Bad
- 1627 W Grab Creek Rd
- 205 Meadowlark Ct
- 1488 Highway 48 S
- 1625 Highway 48 S
- 0 Turkey Creek Rd Unit RTC3013411
- 0 Turkey Creek Rd Unit RTC3035704
- 1275 Highway 48 S
- 1381 Turkey Creek Rd
- 147 Ironhorse Way
- 127 Ironhorse Way
- 105 Ironhorse Way
- 133 Ironhorse Way
- 833 Blakemore Rd
- 122 Ironhorse Way
- 128 Ironhorse Way
- 155 W Piney Rd
- 270 Murrell Rd
- 274 Murrell Rd
- 271 Murrell Rd
- 276 Murrell Rd
- 265 Murrell Rd
- 276 Murrell Rd
- 273 Murrell Rd
- 128 Murrell Rd
- 199 Troy Donegan Rd
- 261 Murrell Rd
- 126 Murrell Rd
- 175 Murrell Rd
- 266 Murrell Rd
- 127 Murrell Rd
- 118 Murrell Rd
- 119 Murrell Rd
- 281 Murrell Rd
- 278 Murrell Rd
- 278 Murrell Rd
- 111 Murrell Rd
Your Personal Tour Guide
Ask me questions while you tour the home.