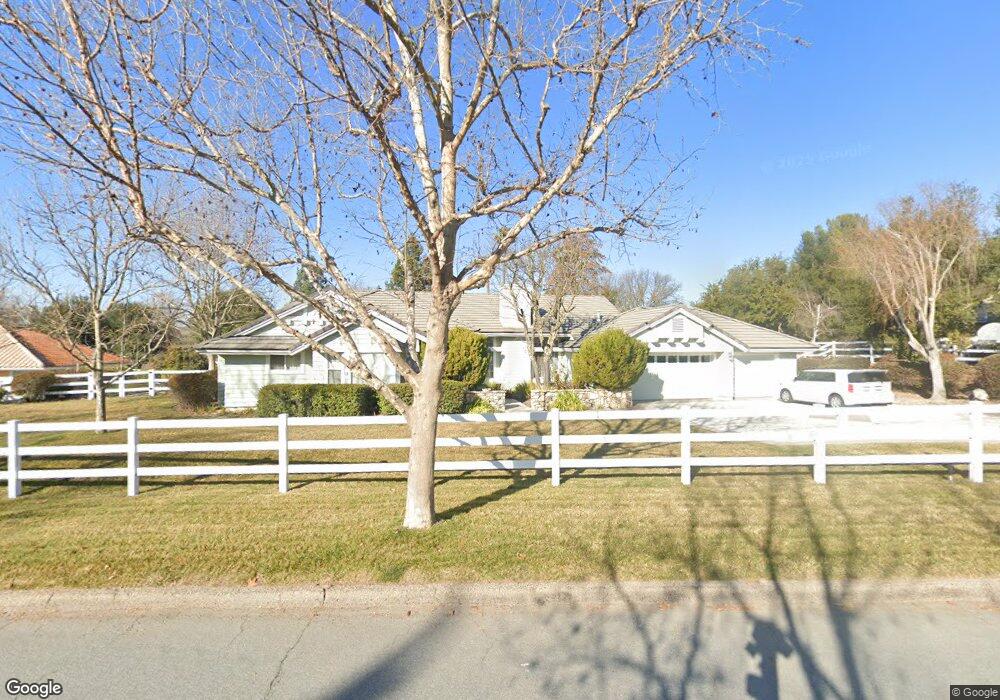
272 Puffin Way Templeton, CA 93465
Estimated Value: $990,000 - $1,757,000
4
Beds
3
Baths
2,750
Sq Ft
$507/Sq Ft
Est. Value
About This Home
This home is located at 272 Puffin Way, Templeton, CA 93465 and is currently estimated at $1,393,917, approximately $506 per square foot. 272 Puffin Way is a home located in San Luis Obispo County with nearby schools including Templeton Elementary School, Vineyard Elementary School, and Templeton Middle School.
Ownership History
Date
Name
Owned For
Owner Type
Purchase Details
Closed on
Nov 3, 2005
Sold by
Cartland James P and Cartland Pamela Miya
Bought by
Cartland James P and Cartland Pamela M
Current Estimated Value
Purchase Details
Closed on
Oct 6, 1995
Sold by
Friedman Mark J and Vansteenwyk Kedrin E
Bought by
Cartland James P and Cartland Pamela Miya
Home Financials for this Owner
Home Financials are based on the most recent Mortgage that was taken out on this home.
Original Mortgage
$296,950
Outstanding Balance
$2,124
Interest Rate
7.8%
Estimated Equity
$1,391,793
Purchase Details
Closed on
May 4, 1995
Sold by
Newton Kenneth H and Votsmier Therese
Bought by
Friedman Mark J and Vansteenwyk Kedrin E
Home Financials for this Owner
Home Financials are based on the most recent Mortgage that was taken out on this home.
Original Mortgage
$263,200
Interest Rate
7.75%
Create a Home Valuation Report for This Property
The Home Valuation Report is an in-depth analysis detailing your home's value as well as a comparison with similar homes in the area
Home Values in the Area
Average Home Value in this Area
Purchase History
| Date | Buyer | Sale Price | Title Company |
|---|---|---|---|
| Cartland James P | -- | -- | |
| Cartland James P | $330,000 | Cuesta Title Guarant Co | |
| Friedman Mark J | $330,000 | Cuesta Title Guaranty Compan |
Source: Public Records
Mortgage History
| Date | Status | Borrower | Loan Amount |
|---|---|---|---|
| Open | Cartland James P | $296,950 | |
| Previous Owner | Friedman Mark J | $263,200 |
Source: Public Records
Tax History Compared to Growth
Tax History
| Year | Tax Paid | Tax Assessment Tax Assessment Total Assessment is a certain percentage of the fair market value that is determined by local assessors to be the total taxable value of land and additions on the property. | Land | Improvement |
|---|---|---|---|---|
| 2025 | $5,920 | $548,093 | $199,332 | $348,761 |
| 2024 | $5,811 | $537,347 | $195,424 | $341,923 |
| 2023 | $5,811 | $526,812 | $191,593 | $335,219 |
| 2022 | $5,698 | $516,484 | $187,837 | $328,647 |
| 2021 | $5,585 | $506,357 | $184,154 | $322,203 |
| 2020 | $5,525 | $501,166 | $182,266 | $318,900 |
| 2019 | $5,237 | $491,341 | $178,693 | $312,648 |
| 2018 | $5,148 | $481,708 | $175,190 | $306,518 |
| 2017 | $5,106 | $472,263 | $171,755 | $300,508 |
| 2016 | $5,006 | $463,004 | $168,388 | $294,616 |
| 2015 | $4,930 | $456,050 | $165,859 | $290,191 |
| 2014 | $4,748 | $447,118 | $162,611 | $284,507 |
Source: Public Records
Map
Nearby Homes
- 1730 Sandalwood Ln
- 117 Frontier Way
- 115 Booker Rd
- 367 Lily Pad Ln
- 0 Old Creek Rd
- 720 Gough Ave
- 2455 Ca-46
- 2455 W Highway 46
- 1220 Bennett Way
- 1220 Bennett Way Unit 83
- 130 Hawley St
- 720 Wild Oats Way
- 2925 Oakdale Rd
- 30 Corrietta Ct
- 156 Horstman St
- 59 8th St
- 8 Championship Ln
- 317 Crocker St
- 2925 Anderson Rd
- 30 S Main St
- 256 Puffin Way
- 308 Puffin Way
- 1613 Tanager Ct
- 222 Puffin Way
- 311 Puffin Way
- 366 Puffin Way
- 1735 Las Tablas Rd
- 1610 Tanager Ct
- 1725 Las Tablas Rd
- 1609 Tanager Ct
- 192 Helgren Ct
- 347 Puffin Way
- 351 Puffin Way
- 185 Pendleton Ln
- 1582 Tanager Ct
- 1571 Tanager Ct
- 1690 Ironwood Place
- 1680 Ironwood Place
- 1710 Ironwood Place
- 353 Puffin Way