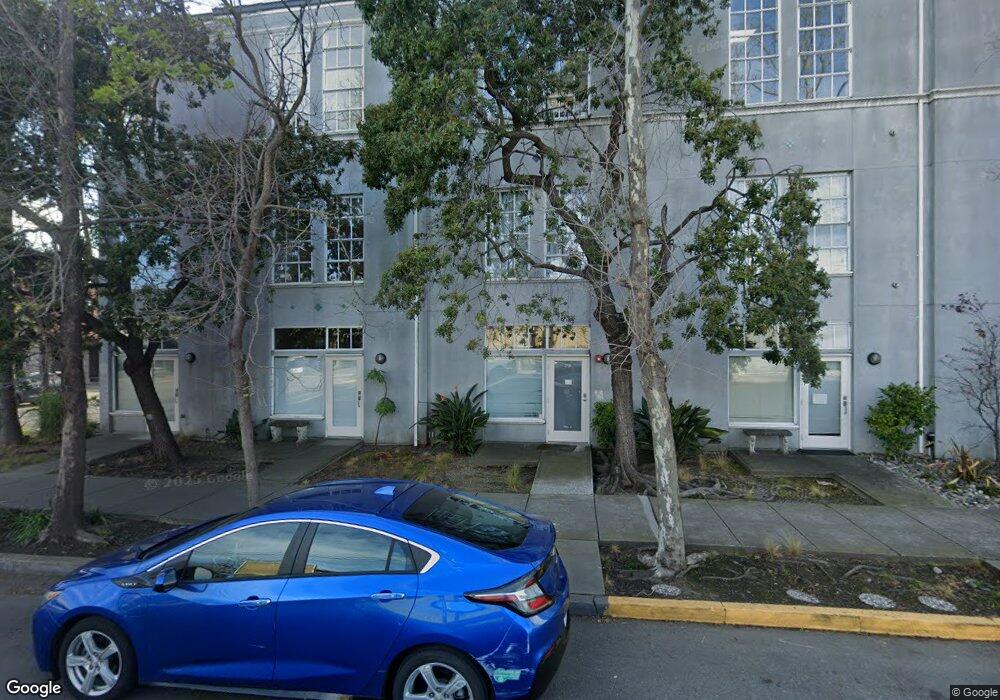
2720 9th St Unit 1 Berkeley, CA 94710
West Berkeley NeighborhoodEstimated Value: $809,000 - $1,093,000
1
Bed
2
Baths
1,699
Sq Ft
$540/Sq Ft
Est. Value
About This Home
This home is located at 2720 9th St Unit 1, Berkeley, CA 94710 and is currently estimated at $917,796, approximately $540 per square foot. 2720 9th St Unit 1 is a home located in Alameda County with nearby schools including Oxford Elementary School, Malcolm X Elementary School, and Washington Elementary School.
Ownership History
Date
Name
Owned For
Owner Type
Purchase Details
Closed on
Aug 16, 2007
Sold by
Chua Christopher V
Bought by
Chua Christopher V
Current Estimated Value
Purchase Details
Closed on
May 22, 2000
Sold by
Ellen Korman and Ellen Mary
Bought by
Chua Christopher V
Home Financials for this Owner
Home Financials are based on the most recent Mortgage that was taken out on this home.
Original Mortgage
$100,000
Outstanding Balance
$34,398
Interest Rate
8.08%
Mortgage Type
Purchase Money Mortgage
Estimated Equity
$883,398
Create a Home Valuation Report for This Property
The Home Valuation Report is an in-depth analysis detailing your home's value as well as a comparison with similar homes in the area
Home Values in the Area
Average Home Value in this Area
Purchase History
| Date | Buyer | Sale Price | Title Company |
|---|---|---|---|
| Chua Christopher V | -- | None Available | |
| Chua Christopher V | $500,500 | First American Title Guarant |
Source: Public Records
Mortgage History
| Date | Status | Borrower | Loan Amount |
|---|---|---|---|
| Open | Chua Christopher V | $100,000 |
Source: Public Records
Tax History
| Year | Tax Paid | Tax Assessment Tax Assessment Total Assessment is a certain percentage of the fair market value that is determined by local assessors to be the total taxable value of land and additions on the property. | Land | Improvement |
|---|---|---|---|---|
| 2025 | $11,599 | $761,444 | $261,271 | $507,173 |
| 2024 | $11,599 | $746,379 | $256,149 | $497,230 |
| 2023 | $11,357 | $738,609 | $251,127 | $487,482 |
| 2022 | $11,155 | $717,129 | $246,204 | $477,925 |
| 2021 | $11,182 | $702,934 | $241,377 | $468,557 |
| 2020 | $10,588 | $702,659 | $238,904 | $463,755 |
| 2019 | $10,178 | $688,884 | $234,220 | $454,664 |
| 2018 | $10,008 | $675,379 | $229,629 | $445,750 |
| 2017 | $9,660 | $662,139 | $225,127 | $437,012 |
| 2016 | $9,353 | $649,159 | $220,714 | $428,445 |
| 2015 | $9,229 | $639,409 | $217,399 | $422,010 |
| 2014 | $9,166 | $626,884 | $213,140 | $413,744 |
Source: Public Records
Map
Nearby Homes
- 1010 Grayson St
- 1034 Grayson St
- 2751 Wallace St
- 1092 Dwight Way
- 1118 Dwight Way
- 1142 Dwight Way
- 1144 Dwight Way
- 2717 Mabel St
- 2411 Sixth St
- 917 Channing Way
- 2341 9th St
- 1237 Ashby Ave
- 1039 Channing Way
- 2327 10th St Unit 4
- 811 Folger Ave
- 1314 Ashby Ave
- 2324 Browning St
- 3032 Mabel St
- 931 Bancroft Way
- 2241 Ninth St
Your Personal Tour Guide
Ask me questions while you tour the home.