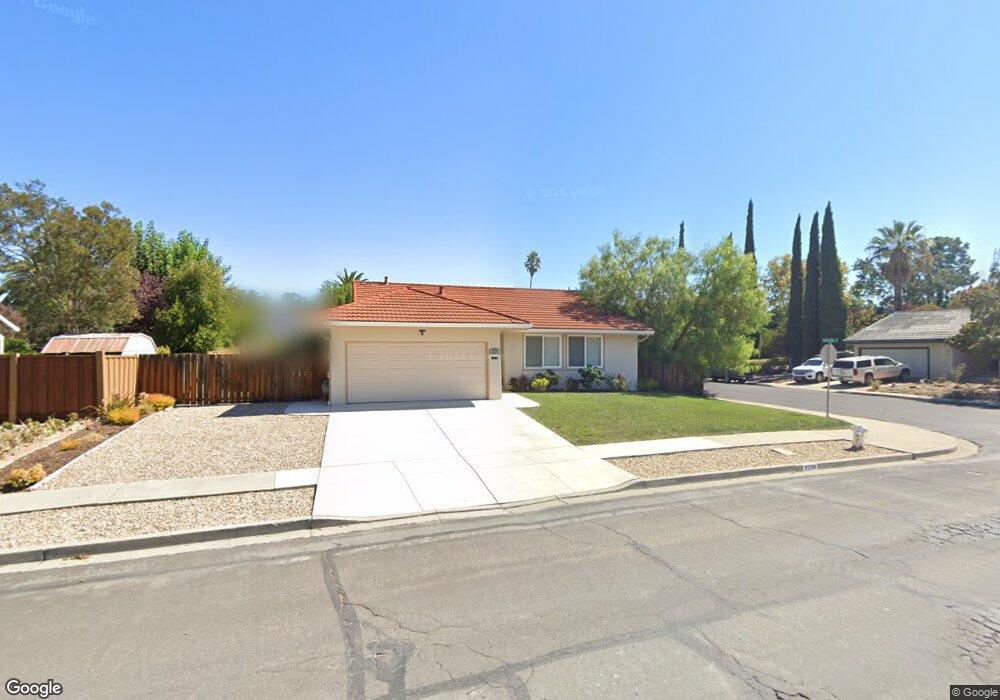
2720 Minert Rd Concord, CA 94518
Vista Diablo/Wilshire Estates NeighborhoodEstimated Value: $769,173 - $848,000
3
Beds
2
Baths
1,148
Sq Ft
$698/Sq Ft
Est. Value
About This Home
This home is located at 2720 Minert Rd, Concord, CA 94518 and is currently estimated at $801,043, approximately $697 per square foot. 2720 Minert Rd is a home located in Contra Costa County with nearby schools including Woodside Elementary School, Oak Grove Middle School, and Ygnacio Valley High School.
Ownership History
Date
Name
Owned For
Owner Type
Purchase Details
Closed on
Sep 12, 2012
Sold by
Hamanaka Isao and Ninomiya Haruko
Bought by
Anderson Charles Edward and Anderson Rebecca Marie
Current Estimated Value
Home Financials for this Owner
Home Financials are based on the most recent Mortgage that was taken out on this home.
Original Mortgage
$245,600
Outstanding Balance
$169,383
Interest Rate
3.5%
Mortgage Type
New Conventional
Estimated Equity
$631,660
Purchase Details
Closed on
Sep 11, 2012
Sold by
Ninomiya Melvin Masaki
Bought by
Ninomiya Haruko
Home Financials for this Owner
Home Financials are based on the most recent Mortgage that was taken out on this home.
Original Mortgage
$245,600
Outstanding Balance
$169,383
Interest Rate
3.5%
Mortgage Type
New Conventional
Estimated Equity
$631,660
Purchase Details
Closed on
Feb 8, 2011
Sold by
The Hamanaka Family Trust
Bought by
Hamanaka Isao and Ninomiya Haruko
Purchase Details
Closed on
Nov 11, 2000
Sold by
Hamanaka Mitsugo Ko and Hamanaka Kazue
Bought by
Hamanaka Mitsugu Ko and Hamanaka Kazue
Create a Home Valuation Report for This Property
The Home Valuation Report is an in-depth analysis detailing your home's value as well as a comparison with similar homes in the area
Home Values in the Area
Average Home Value in this Area
Purchase History
| Date | Buyer | Sale Price | Title Company |
|---|---|---|---|
| Anderson Charles Edward | $307,500 | Old Republic Title Company | |
| Ninomiya Haruko | -- | Old Republic Title Company | |
| Hamanaka Isao | -- | None Available | |
| Hamanaka Mitsugu Ko | -- | -- |
Source: Public Records
Mortgage History
| Date | Status | Borrower | Loan Amount |
|---|---|---|---|
| Open | Anderson Charles Edward | $245,600 |
Source: Public Records
Tax History
| Year | Tax Paid | Tax Assessment Tax Assessment Total Assessment is a certain percentage of the fair market value that is determined by local assessors to be the total taxable value of land and additions on the property. | Land | Improvement |
|---|---|---|---|---|
| 2025 | $5,185 | $378,035 | $257,362 | $120,673 |
| 2024 | $4,938 | $370,623 | $252,316 | $118,307 |
| 2023 | $4,938 | $363,357 | $247,369 | $115,988 |
| 2022 | $4,860 | $356,233 | $242,519 | $113,714 |
| 2021 | $4,732 | $349,249 | $237,764 | $111,485 |
| 2019 | $4,635 | $338,892 | $230,713 | $108,179 |
| 2018 | $4,454 | $332,248 | $226,190 | $106,058 |
| 2017 | $4,299 | $325,734 | $221,755 | $103,979 |
| 2016 | $4,168 | $319,348 | $217,407 | $101,941 |
| 2015 | $4,106 | $314,552 | $214,142 | $100,410 |
| 2014 | $4,022 | $308,392 | $209,948 | $98,444 |
Source: Public Records
Map
Nearby Homes
- 2745 Minert Rd
- 928 Sassel Ave
- 2605 Ryan Rd
- 804 San Simeon Dr
- 3055 Treat Blvd Unit 36
- 825 Oak Grove Rd Unit 46
- 825 Oak Grove Rd Unit 62
- 3061 San Miguel Ct
- 1005 Claremont Dr
- 1036 Oak Grove Rd Unit 23
- 1036 Oak Grove Rd Unit 86
- 1036 Oak Grove Rd Unit 21
- 91 Terrace Ct
- 2055 Sierra Rd Unit 12
- 2055 Sierra Rd Unit 53
- 2055 Sierra Rd Unit 101
- 2840 Royal Ann Ln
- 1766 Risdon Rd
- 1921 Gilly Ln
- 2045 Sierra Rd Unit 2