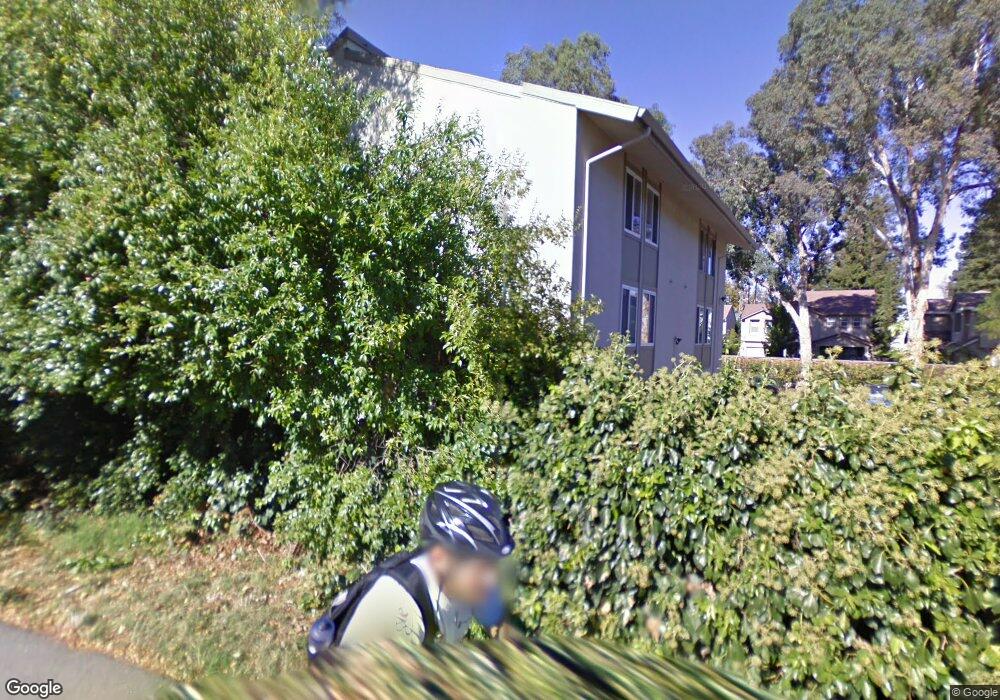
2720 Oak Rd Unit 129 Walnut Creek, CA 94597
Contra Costa Centre NeighborhoodEstimated Value: $436,489 - $502,000
2
Beds
1
Bath
882
Sq Ft
$530/Sq Ft
Est. Value
About This Home
This home is located at 2720 Oak Rd Unit 129, Walnut Creek, CA 94597 and is currently estimated at $467,372, approximately $529 per square foot. 2720 Oak Rd Unit 129 is a home located in Contra Costa County with nearby schools including Indian Valley Elementary School, Walnut Creek Intermediate School, and Las Lomas High School.
Ownership History
Date
Name
Owned For
Owner Type
Purchase Details
Closed on
Aug 25, 2022
Sold by
Hester and Elaine
Bought by
Zelaya Josias E
Current Estimated Value
Home Financials for this Owner
Home Financials are based on the most recent Mortgage that was taken out on this home.
Original Mortgage
$395,502
Outstanding Balance
$378,007
Interest Rate
5.3%
Mortgage Type
FHA
Estimated Equity
$89,365
Purchase Details
Closed on
Mar 21, 2008
Sold by
Hester Glen
Bought by
Hester Glen and Hester Elaine
Purchase Details
Closed on
Sep 9, 2003
Sold by
Hester Elaine
Bought by
Hester Glen
Home Financials for this Owner
Home Financials are based on the most recent Mortgage that was taken out on this home.
Original Mortgage
$210,800
Interest Rate
6.06%
Mortgage Type
Stand Alone First
Create a Home Valuation Report for This Property
The Home Valuation Report is an in-depth analysis detailing your home's value as well as a comparison with similar homes in the area
Home Values in the Area
Average Home Value in this Area
Purchase History
| Date | Buyer | Sale Price | Title Company |
|---|---|---|---|
| Zelaya Josias E | $455,000 | Chicago Title | |
| Hester Glen | -- | None Available | |
| Hester Glen | -- | New Century Title Company | |
| Hester Glen | $264,000 | New Century Title Company |
Source: Public Records
Mortgage History
| Date | Status | Borrower | Loan Amount |
|---|---|---|---|
| Open | Zelaya Josias E | $395,502 | |
| Previous Owner | Hester Glen | $210,800 | |
| Closed | Hester Glen | $39,525 | |
| Closed | Zelaya Josias E | $45,500 |
Source: Public Records
Tax History Compared to Growth
Tax History
| Year | Tax Paid | Tax Assessment Tax Assessment Total Assessment is a certain percentage of the fair market value that is determined by local assessors to be the total taxable value of land and additions on the property. | Land | Improvement |
|---|---|---|---|---|
| 2025 | $6,204 | $473,382 | $332,928 | $140,454 |
| 2024 | $6,058 | $464,100 | $326,400 | $137,700 |
| 2023 | $6,058 | $455,000 | $320,000 | $135,000 |
| 2022 | $4,955 | $353,019 | $247,852 | $105,167 |
| 2021 | $4,822 | $346,098 | $242,993 | $103,105 |
| 2019 | $4,702 | $335,835 | $235,787 | $100,048 |
| 2018 | $4,559 | $329,251 | $231,164 | $98,087 |
| 2017 | $4,465 | $322,796 | $226,632 | $96,164 |
| 2016 | $4,370 | $316,468 | $222,189 | $94,279 |
| 2015 | $4,272 | $311,715 | $218,852 | $92,863 |
| 2014 | $3,608 | $250,000 | $175,522 | $74,478 |
Source: Public Records
Map
Nearby Homes
- 2716 Oak Rd Unit 117
- 2716 Oak Rd Unit 111
- 2724 Oak Rd Unit 88
- 2704 Oak Rd Unit 80
- 2712 Oak Rd Unit 57
- 2712 Oak Rd Unit 60
- 2708 Oak Rd Unit 9
- 2709 Oak Rd Unit H
- 2735 Oak Rd
- 178 Oak Cir
- Plan 4X at Oak Grove
- Plan 6 at Oak Grove
- Plan 3 at Oak Grove
- Plan 5 at Oak Grove
- Plan 6X at Oak Grove
- Plan 5X at Oak Grove
- 225 Oak Cir
- 13 Oak Treat Ct
- 231 Oak Cir
- 2592 Oak Rd Unit 160
- 2720 Oak Rd Unit 127
- 2720 Oak Rd Unit 126
- 2720 Oak Rd Unit 125
- 2720 Oak Rd Unit 124
- 2720 Oak Rd Unit 137
- 2720 Oak Rd Unit 135
- 2720 Oak Rd Unit 134
- 2720 Oak Rd Unit 133
- 2720 Oak Rd Unit 132
- 2720 Oak Rd Unit 130
- 2720 Oak Rd Unit 128
- 353 Parnell Ct Unit 353
- 343 Parnell Ct Unit 345
- 351 Parnell Ct Unit 353
- 347 Parnell Ct Unit 349
- 339 Parnell Ct
- 2716 Oak Rd
- 2716 Oak Rd Unit 95
- 2716 Oak Rd Unit 94
- 2716 Oak Rd Unit 116