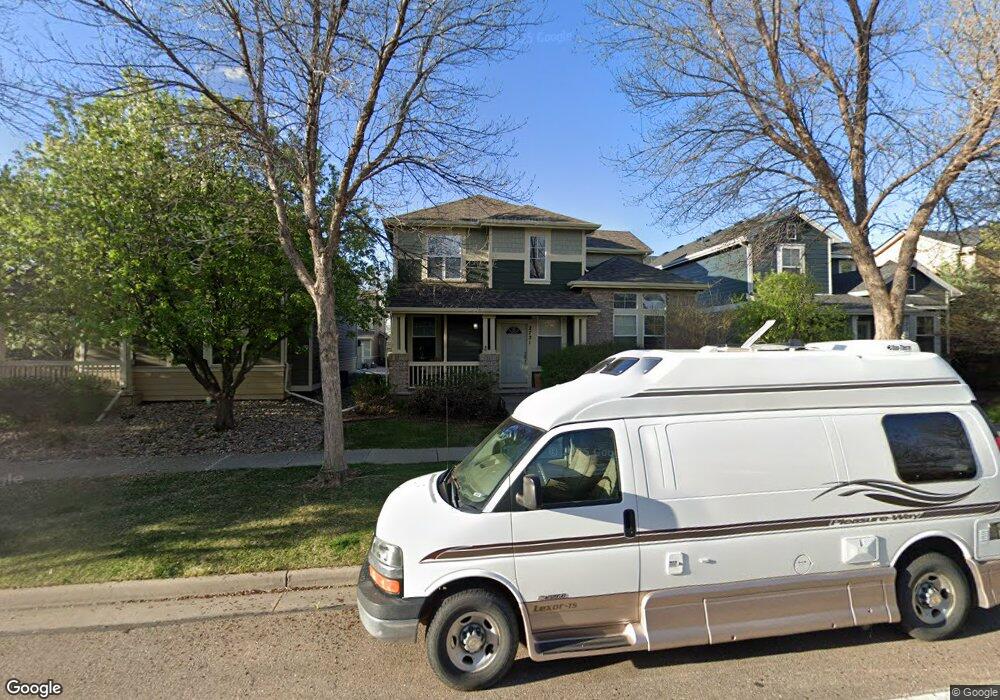
2721 Rock Creek Dr Fort Collins, CO 80528
Estimated Value: $589,000 - $658,000
4
Beds
3
Baths
2,357
Sq Ft
$266/Sq Ft
Est. Value
About This Home
This home is located at 2721 Rock Creek Dr, Fort Collins, CO 80528 and is currently estimated at $626,610, approximately $265 per square foot. 2721 Rock Creek Dr is a home located in Larimer County with nearby schools including Bacon Elementary School, Preston Middle School, and Fossil Ridge High School.
Ownership History
Date
Name
Owned For
Owner Type
Purchase Details
Closed on
Oct 20, 2025
Sold by
Koza Richard A and Koza Kristin L
Bought by
Chief Rentals Llc
Current Estimated Value
Purchase Details
Closed on
Nov 2, 2007
Sold by
Koza Rick
Bought by
Koza Richard A and Koza Kristin L
Purchase Details
Closed on
Aug 27, 2007
Sold by
Sullivan Michael Scott
Bought by
Deutsche Bank Trust Co Americas
Purchase Details
Closed on
Dec 17, 2004
Sold by
Standard Pacific Of Colorado Inc
Bought by
Sullivan Michael Scott
Home Financials for this Owner
Home Financials are based on the most recent Mortgage that was taken out on this home.
Original Mortgage
$195,760
Interest Rate
6.12%
Mortgage Type
Purchase Money Mortgage
Create a Home Valuation Report for This Property
The Home Valuation Report is an in-depth analysis detailing your home's value as well as a comparison with similar homes in the area
Home Values in the Area
Average Home Value in this Area
Purchase History
| Date | Buyer | Sale Price | Title Company |
|---|---|---|---|
| Chief Rentals Llc | $500 | None Listed On Document | |
| Koza Richard A | -- | Fahtco | |
| Koza Rick | $230,000 | Fahtco | |
| Deutsche Bank Trust Co Americas | -- | None Available | |
| Sullivan Michael Scott | $244,730 | Land Title Guarantee Company |
Source: Public Records
Mortgage History
| Date | Status | Borrower | Loan Amount |
|---|---|---|---|
| Previous Owner | Sullivan Michael Scott | $195,760 | |
| Closed | Sullivan Michael Scott | $48,940 |
Source: Public Records
Tax History Compared to Growth
Tax History
| Year | Tax Paid | Tax Assessment Tax Assessment Total Assessment is a certain percentage of the fair market value that is determined by local assessors to be the total taxable value of land and additions on the property. | Land | Improvement |
|---|---|---|---|---|
| 2025 | $3,994 | $44,562 | $10,385 | $34,177 |
| 2024 | $3,806 | $44,562 | $10,385 | $34,177 |
| 2022 | $3,151 | $32,679 | $3,684 | $28,995 |
| 2021 | $3,186 | $33,620 | $3,790 | $29,830 |
| 2020 | $2,945 | $30,817 | $3,790 | $27,027 |
| 2019 | $2,957 | $30,817 | $3,790 | $27,027 |
| 2018 | $2,675 | $28,721 | $3,816 | $24,905 |
| 2017 | $2,666 | $28,721 | $3,816 | $24,905 |
| 2016 | $2,576 | $27,613 | $4,219 | $23,394 |
| 2015 | $2,557 | $27,610 | $4,220 | $23,390 |
| 2014 | $2,115 | $22,690 | $4,220 | $18,470 |
Source: Public Records
Map
Nearby Homes
- 2633 Rock Creek Dr
- 2759 Harvest Park Ln
- 5234 Cornerstone Dr
- 5356 Cornerstone Dr
- 2602 Timberwood Dr Unit 2
- 2602 Timberwood Dr Unit 52
- 4913 Smallwood Ct
- 2120 Timber Creek Dr Unit H4
- 5639 Cardinal Flower Ct
- 5609 Coppervein St
- 2107 Stillwater Creek Dr
- 5121 Stillwater Creek Dr Unit B
- 5850 Dripping Rock Ln Unit A201
- 5850 Dripping Rock Ln Unit G103
- 3247 Muskrat Creek Dr
- 5225 White Willow Dr Unit F200
- 5225 White Willow Dr Unit J110
- 3149 Shallow Pond Dr
- 5702 Falling Water Dr
- 5739 Falling Water Dr
- 2727 Rock Creek Dr
- 2715 Rock Creek Dr
- 2709 Rock Creek Dr
- 2720 Autumn Harvest Way
- 2714 Autumn Harvest Way
- 2726 Autumn Harvest Way
- 2708 Autumn Harvest Way
- 2739 Rock Creek Dr
- 2702 Autumn Harvest Way
- 2738 Autumn Harvest Way
- 5139 Harvest Moon Way
- 2720 Rock Creek Dr
- 2714 Rock Creek Dr
- 2745 Rock Creek Dr
- 2708 Rock Creek Dr
- 5138 Old Mill Rd
- 2744 Autumn Harvest Way
- 2751 Rock Creek Dr
- 2721 Autumn Harvest Way
- 2715 Autumn Harvest Way