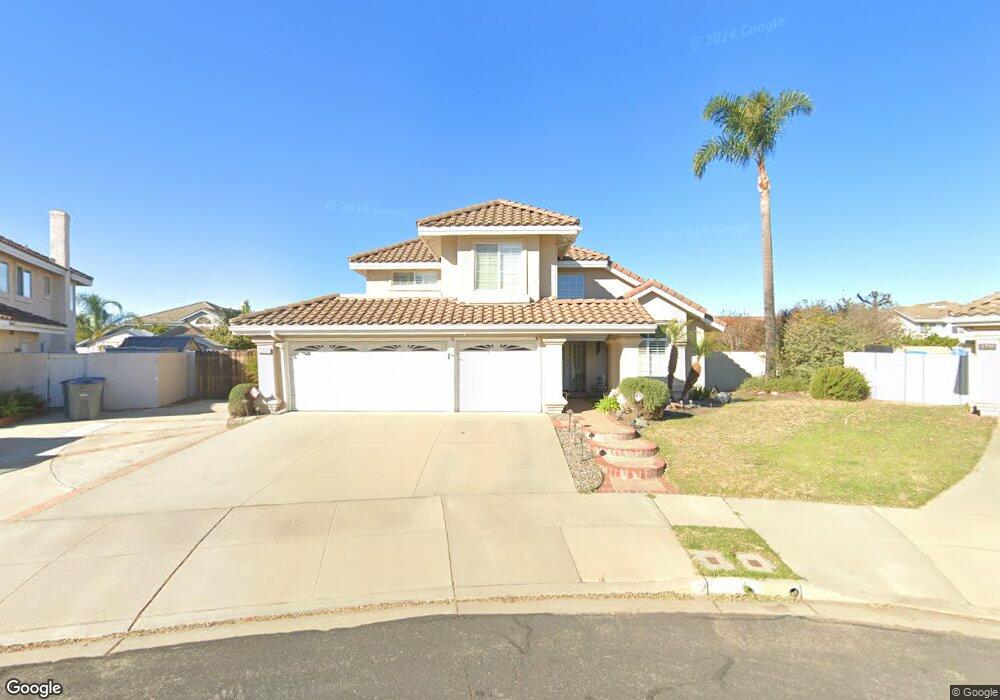
2721 Ruby Dr Oxnard, CA 93030
Cabrillo NeighborhoodEstimated Value: $1,040,000 - $1,090,000
4
Beds
3
Baths
2,482
Sq Ft
$428/Sq Ft
Est. Value
About This Home
This home is located at 2721 Ruby Dr, Oxnard, CA 93030 and is currently estimated at $1,062,965, approximately $428 per square foot. 2721 Ruby Dr is a home located in Ventura County with nearby schools including Emilie Ritchen Elementary School, Oxnard High School, and Our Redeemer's Nursery School.
Ownership History
Date
Name
Owned For
Owner Type
Purchase Details
Closed on
Jun 3, 2013
Sold by
Garrett James W and Garrett Deborah C
Bought by
Lopez Carey A and Lopez Michelle
Current Estimated Value
Home Financials for this Owner
Home Financials are based on the most recent Mortgage that was taken out on this home.
Original Mortgage
$437,600
Outstanding Balance
$309,753
Interest Rate
3.38%
Mortgage Type
New Conventional
Estimated Equity
$753,212
Purchase Details
Closed on
Oct 25, 2000
Sold by
Chio Chen Chia and Cheng Yu Chu
Bought by
Garrett James W and Garrett Deborah C
Home Financials for this Owner
Home Financials are based on the most recent Mortgage that was taken out on this home.
Original Mortgage
$180,000
Interest Rate
7.67%
Create a Home Valuation Report for This Property
The Home Valuation Report is an in-depth analysis detailing your home's value as well as a comparison with similar homes in the area
Home Values in the Area
Average Home Value in this Area
Purchase History
| Date | Buyer | Sale Price | Title Company |
|---|---|---|---|
| Lopez Carey A | $547,000 | Fidelity National Title Co | |
| Garrett James W | $360,500 | Old Republic Title Ins Compa |
Source: Public Records
Mortgage History
| Date | Status | Borrower | Loan Amount |
|---|---|---|---|
| Open | Lopez Carey A | $437,600 | |
| Previous Owner | Garrett James W | $180,000 |
Source: Public Records
Tax History
| Year | Tax Paid | Tax Assessment Tax Assessment Total Assessment is a certain percentage of the fair market value that is determined by local assessors to be the total taxable value of land and additions on the property. | Land | Improvement |
|---|---|---|---|---|
| 2025 | $8,173 | $690,327 | $269,677 | $420,650 |
| 2024 | $8,173 | $660,370 | $264,389 | $395,981 |
| 2023 | $7,822 | $647,422 | $259,205 | $388,217 |
| 2022 | $7,609 | $634,728 | $254,123 | $380,605 |
| 2021 | $7,587 | $622,283 | $249,140 | $373,143 |
| 2020 | $7,726 | $615,905 | $246,587 | $369,318 |
| 2019 | $7,509 | $603,829 | $241,752 | $362,077 |
| 2018 | $7,403 | $591,990 | $237,012 | $354,978 |
| 2017 | $7,029 | $580,383 | $232,365 | $348,018 |
| 2016 | $6,785 | $569,004 | $227,809 | $341,195 |
| 2015 | $6,855 | $560,459 | $224,388 | $336,071 |
| 2014 | $6,779 | $549,483 | $219,994 | $329,489 |
Source: Public Records
Map
Nearby Homes
- 1721 Joanne Way
- 2134 Cold Stream Ct
- 2035 Long Cove Dr
- 1440 Ivywood Dr
- 2113 Doral Ct
- 3325 Eagle Bend Ln
- 2110 Rhonda St
- 2177 Eastridge Trail
- 1341 Edgewood Way Unit 23
- 2100 Norma St
- 2151 Olga St
- 1220 W Robert Ave
- 2310 Crown Point Ct
- 462 N M St
- 1127 Douglas Ave
- 1010 Janetwood Dr
- 1361 Gardenia St
- 729 Ivywood Dr
- 1340 Kumquat Place
- 722 W Robert Ave
Your Personal Tour Guide
Ask me questions while you tour the home.