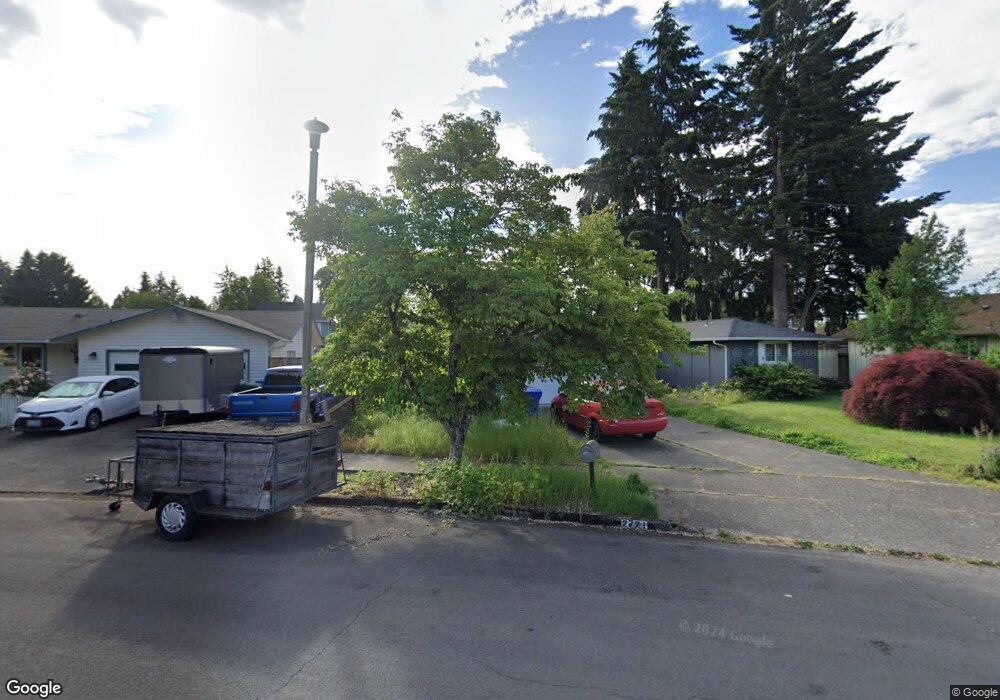
2721 Summer Ln Eugene, OR 97404
Santa Clara NeighborhoodEstimated Value: $434,280 - $468,000
3
Beds
2
Baths
1,412
Sq Ft
$321/Sq Ft
Est. Value
About This Home
This home is located at 2721 Summer Ln, Eugene, OR 97404 and is currently estimated at $452,820, approximately $320 per square foot. 2721 Summer Ln is a home located in Lane County with nearby schools including Awbrey Park Elementary School, Madison Middle School, and North Eugene High School.
Ownership History
Date
Name
Owned For
Owner Type
Purchase Details
Closed on
Dec 28, 2006
Sold by
Gregg Shawn R and Lassman Tanya E
Bought by
Robbins Brianna L
Current Estimated Value
Home Financials for this Owner
Home Financials are based on the most recent Mortgage that was taken out on this home.
Original Mortgage
$45,180
Interest Rate
5.89%
Mortgage Type
Stand Alone Second
Purchase Details
Closed on
Oct 23, 1998
Sold by
Mcfadden Evelyn F
Bought by
Gregg Shawn R and Gregg Tanya E
Home Financials for this Owner
Home Financials are based on the most recent Mortgage that was taken out on this home.
Original Mortgage
$118,750
Interest Rate
6.6%
Create a Home Valuation Report for This Property
The Home Valuation Report is an in-depth analysis detailing your home's value as well as a comparison with similar homes in the area
Home Values in the Area
Average Home Value in this Area
Purchase History
| Date | Buyer | Sale Price | Title Company |
|---|---|---|---|
| Robbins Brianna L | $225,900 | Fidelity National Title Insu | |
| Gregg Shawn R | $125,000 | Fidelity National Title Ins |
Source: Public Records
Mortgage History
| Date | Status | Borrower | Loan Amount |
|---|---|---|---|
| Closed | Robbins Brianna L | $45,180 | |
| Open | Robbins Brianna L | $180,720 | |
| Previous Owner | Gregg Shawn R | $118,750 |
Source: Public Records
Tax History
| Year | Tax Paid | Tax Assessment Tax Assessment Total Assessment is a certain percentage of the fair market value that is determined by local assessors to be the total taxable value of land and additions on the property. | Land | Improvement |
|---|---|---|---|---|
| 2025 | $2,886 | $225,471 | -- | -- |
| 2024 | $2,871 | $218,904 | -- | -- |
| 2023 | $2,871 | $212,529 | $0 | $0 |
| 2022 | $2,698 | $206,339 | $0 | $0 |
| 2021 | $2,476 | $200,330 | $0 | $0 |
| 2020 | $2,522 | $194,496 | $0 | $0 |
| 2019 | $2,429 | $188,832 | $0 | $0 |
| 2018 | $2,236 | $177,993 | $0 | $0 |
| 2017 | $2,101 | $177,993 | $0 | $0 |
| 2016 | $1,959 | $172,809 | $0 | $0 |
| 2015 | $1,887 | $167,776 | $0 | $0 |
| 2014 | $1,764 | $162,889 | $0 | $0 |
Source: Public Records
Map
Nearby Homes
- 0 450-1 Unit 582743661
- 450 Hunsaker Ln
- 0 450-2 Unit 657824339
- 2640 Green Villa Ln
- 463 Salty Way
- 425 Autumn Ave
- 190 Hunsaker Ln
- 190 River Loop 1
- 501 Division Ave Unit 11
- 501 Division Ave Unit 20
- 193 Santa Clara Ave
- 215 Jonquil Ave
- 200 Irving Rd
- 2439 Quince St
- 3346 Zane Ln
- 3352 Zane Ln
- 303 Lenore Loop
- 401 Sterling Dr
- 349 Irving Rd
- 1880 Manihi Dr
Your Personal Tour Guide
Ask me questions while you tour the home.