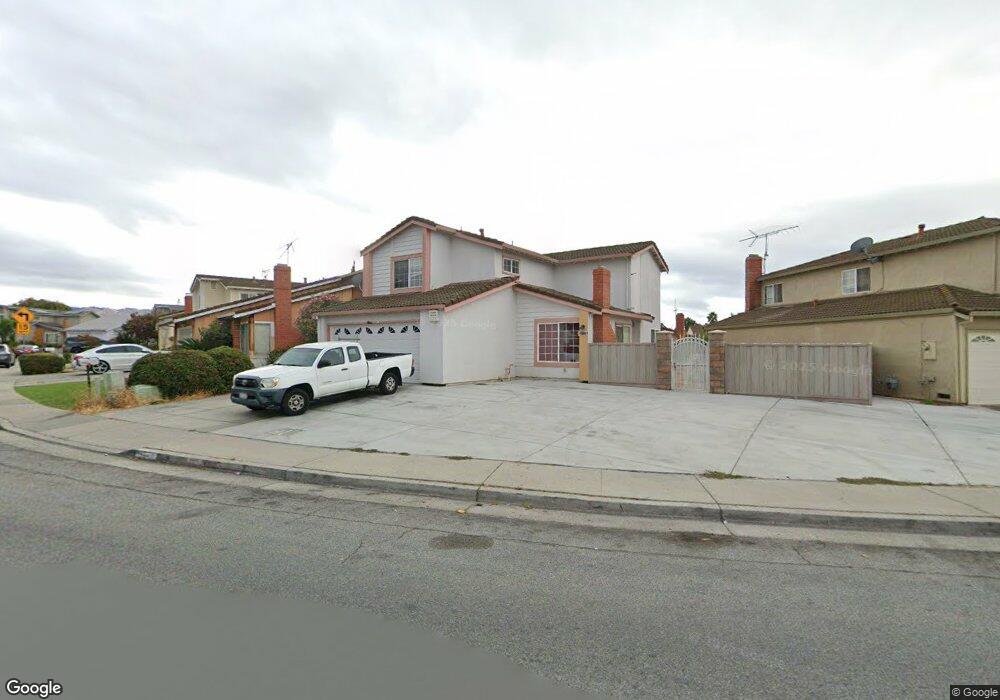
2722 Rainfield Dr San Jose, CA 95133
Penitencia NeighborhoodEstimated Value: $1,313,000 - $1,417,000
4
Beds
3
Baths
1,594
Sq Ft
$856/Sq Ft
Est. Value
About This Home
This home is located at 2722 Rainfield Dr, San Jose, CA 95133 and is currently estimated at $1,364,793, approximately $856 per square foot. 2722 Rainfield Dr is a home located in Santa Clara County with nearby schools including Ben Painter Elementary School, William Sheppard Middle School, and James Lick High School.
Ownership History
Date
Name
Owned For
Owner Type
Purchase Details
Closed on
Apr 14, 2005
Sold by
Gutierrez Rafael Ortiz and De Gutierrez Yolanda
Bought by
Kha Nhu and Makha Linda
Current Estimated Value
Home Financials for this Owner
Home Financials are based on the most recent Mortgage that was taken out on this home.
Original Mortgage
$496,000
Outstanding Balance
$255,458
Interest Rate
5.75%
Mortgage Type
Purchase Money Mortgage
Estimated Equity
$1,109,335
Purchase Details
Closed on
Jul 17, 2002
Sold by
Aguilar Manuel
Bought by
Gutierrez Rafael Ortiz and Degutierrez Yolanda
Home Financials for this Owner
Home Financials are based on the most recent Mortgage that was taken out on this home.
Original Mortgage
$420,000
Interest Rate
6.75%
Purchase Details
Closed on
Mar 27, 2001
Sold by
Ho Tai Ping and Ho Ru Ping
Bought by
Aguilar Manuel
Home Financials for this Owner
Home Financials are based on the most recent Mortgage that was taken out on this home.
Original Mortgage
$400,000
Interest Rate
6.75%
Create a Home Valuation Report for This Property
The Home Valuation Report is an in-depth analysis detailing your home's value as well as a comparison with similar homes in the area
Home Values in the Area
Average Home Value in this Area
Purchase History
| Date | Buyer | Sale Price | Title Company |
|---|---|---|---|
| Kha Nhu | $620,000 | First American Title Company | |
| Gutierrez Rafael Ortiz | $325,000 | Alliance Title Company | |
| Aguilar Manuel | $500,000 | Fidelity National Title Co |
Source: Public Records
Mortgage History
| Date | Status | Borrower | Loan Amount |
|---|---|---|---|
| Open | Kha Nhu | $496,000 | |
| Previous Owner | Gutierrez Rafael Ortiz | $420,000 | |
| Previous Owner | Aguilar Manuel | $400,000 | |
| Closed | Gutierrez Rafael Ortiz | $78,700 |
Source: Public Records
Tax History Compared to Growth
Tax History
| Year | Tax Paid | Tax Assessment Tax Assessment Total Assessment is a certain percentage of the fair market value that is determined by local assessors to be the total taxable value of land and additions on the property. | Land | Improvement |
|---|---|---|---|---|
| 2025 | $13,258 | $864,208 | $515,739 | $348,469 |
| 2024 | $13,258 | $847,264 | $505,627 | $341,637 |
| 2023 | $13,004 | $830,652 | $495,713 | $334,939 |
| 2022 | $12,743 | $814,366 | $485,994 | $328,372 |
| 2021 | $12,300 | $798,399 | $476,465 | $321,934 |
| 2020 | $12,020 | $790,213 | $471,580 | $318,633 |
| 2019 | $11,244 | $774,720 | $462,334 | $312,386 |
| 2018 | $11,111 | $759,530 | $453,269 | $306,261 |
| 2017 | $11,170 | $744,638 | $444,382 | $300,256 |
| 2016 | $10,536 | $730,038 | $435,669 | $294,369 |
| 2015 | $8,380 | $552,000 | $329,400 | $222,600 |
| 2014 | $7,360 | $504,000 | $300,800 | $203,200 |
Source: Public Records
Map
Nearby Homes
- 2623 Gimelli Place Unit 139
- 2599 Easton Ln Unit 108
- 2599 Easton Ln Unit 109
- 750 Fruit Ranch Loop
- 2580 Gimelli Way
- 571 Apricot Way
- 559 Apricot Way
- 2432 Kita Ln
- 2420 Kita Ln
- 714 N Capitol Ave
- 633 Easton Dr
- 674 Galleon Ct
- 709 Whitewater Ct Unit 44
- 2714 Mabury Square
- 2598 Mabury Square
- 673 Kirk Glen Dr
- 825 N Capitol Ave Unit 4
- 693 Kirk Glen Dr
- 259 N Capitol Ave Unit 171
- 259 N Capitol Ave Unit 131
- 2714 Rainfield Dr
- 2726 Rainfield Dr
- 2710 Rainfield Dr
- 2730 Rainfield Dr
- 556 Rainwell Dr
- 552 Rainwell Dr
- 2719 Rainfield Dr
- 2723 Rainfield Dr
- 2706 Rainfield Dr
- 2734 Rainfield Dr
- 560 Rainwell Dr
- 2715 Rainfield Dr
- 2852 Rainview Dr
- 548 Rainwell Dr
- 2839 Rainview Dr
- 586 Rainwell Dr
- 2738 Rainfield Dr
- 2844 Rainview Dr
- 544 Rainwell Dr
- 590 Rainwell Dr