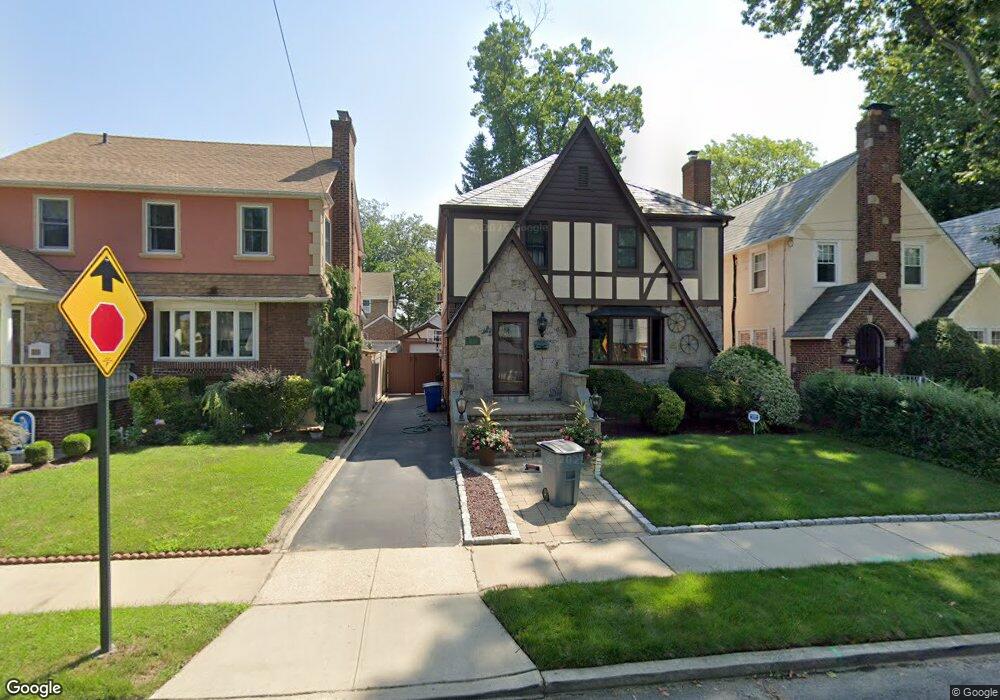
2723 164th St Flushing, NY 11358
Murray Hill-Broadway NeighborhoodEstimated Value: $1,155,000 - $1,204,000
Studio
--
Bath
1,598
Sq Ft
$739/Sq Ft
Est. Value
About This Home
This home is located at 2723 164th St, Flushing, NY 11358 and is currently estimated at $1,181,667, approximately $739 per square foot. 2723 164th St is a home located in Queens County with nearby schools including P.S. 184 Flushing Manor, I.S. 25 Adrien Block, and Francis Lewis High School.
Ownership History
Date
Name
Owned For
Owner Type
Purchase Details
Closed on
May 23, 2025
Sold by
Borsch Maria and Borsch John M
Bought by
Borsch Family Trust Dated /2025 and John M Borsch Sr As Co-Trustees
Current Estimated Value
Purchase Details
Closed on
Oct 27, 2003
Sold by
Bielecki Andrzej and Bielecki Margaret Gorzata
Bought by
Borsch John M and Borsch Maria
Home Financials for this Owner
Home Financials are based on the most recent Mortgage that was taken out on this home.
Original Mortgage
$322,700
Interest Rate
5.83%
Mortgage Type
Purchase Money Mortgage
Purchase Details
Closed on
Dec 2, 1999
Sold by
Guinta Angelo and Guinta Louise
Bought by
Bielecki Andrzej and Bielecki Mal Gorzata
Home Financials for this Owner
Home Financials are based on the most recent Mortgage that was taken out on this home.
Original Mortgage
$200,000
Interest Rate
6.75%
Mortgage Type
Purchase Money Mortgage
Create a Home Valuation Report for This Property
The Home Valuation Report is an in-depth analysis detailing your home's value as well as a comparison with similar homes in the area
Home Values in the Area
Average Home Value in this Area
Purchase History
| Date | Buyer | Sale Price | Title Company |
|---|---|---|---|
| Borsch Family Trust Dated /2025 | -- | -- | |
| Borsch Family Trust Dated /2025 | -- | -- | |
| Borsch John M | $650,000 | -- | |
| Borsch John M | $650,000 | -- | |
| Bielecki Andrzej | $365,000 | First American Title Ins Co | |
| Bielecki Andrzej | $365,000 | First American Title Ins Co |
Source: Public Records
Mortgage History
| Date | Status | Borrower | Loan Amount |
|---|---|---|---|
| Previous Owner | Borsch John M | $322,700 | |
| Previous Owner | Bielecki Andrzej | $200,000 | |
| Closed | Borsch John M | $37,300 |
Source: Public Records
Tax History
| Year | Tax Paid | Tax Assessment Tax Assessment Total Assessment is a certain percentage of the fair market value that is determined by local assessors to be the total taxable value of land and additions on the property. | Land | Improvement |
|---|---|---|---|---|
| 2025 | $9,499 | $48,476 | $13,203 | $35,273 |
| 2024 | $9,499 | $47,294 | $13,925 | $33,369 |
| 2023 | $8,981 | $44,716 | $13,177 | $31,539 |
| 2022 | $8,644 | $65,520 | $20,280 | $45,240 |
| 2021 | $8,497 | $65,700 | $20,280 | $45,420 |
| 2020 | $8,255 | $61,500 | $20,280 | $41,220 |
| 2019 | $7,952 | $61,260 | $20,280 | $40,980 |
| 2018 | $7,298 | $37,263 | $13,485 | $23,778 |
| 2017 | $6,931 | $35,470 | $13,764 | $21,706 |
| 2016 | $6,423 | $35,470 | $13,764 | $21,706 |
| 2015 | $3,816 | $33,664 | $16,945 | $16,719 |
| 2014 | $3,816 | $32,844 | $17,721 | $15,123 |
Source: Public Records
Map
Nearby Homes
- 27-22 Bayside Ln
- 2724 166th St
- 16407 27th Ave
- 2942 164th St
- 16419 32nd Ave
- 16042 26th Ave
- 27-25 168th St
- 25-26 Bayside Ln
- 2934 161st St
- 29 Avenue
- 24-44 163rd St
- 29-37 168th St
- 32-16 167th St
- 15911 29th Ave
- 2533 Francis Lewis Blvd
- 32-35 164th St
- 24-65 Francis Lewis Blvd
- 32-15 161st St
- 32-30 167th St
- 164-04 33rd Ave
Your Personal Tour Guide
Ask me questions while you tour the home.