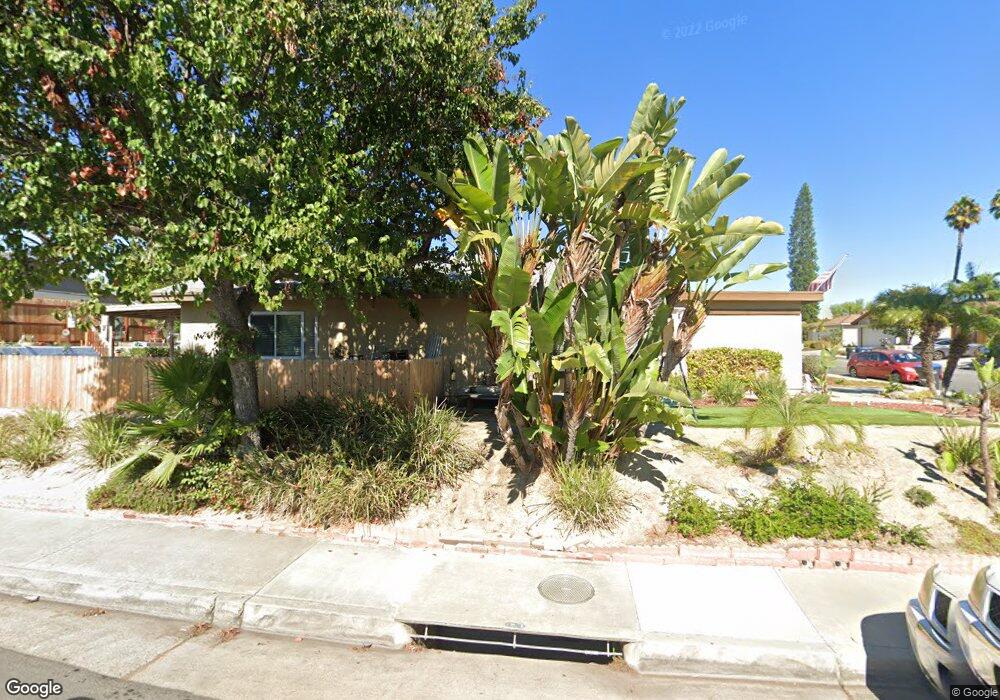
27231 Miraflores Mission Viejo, CA 92692
Estimated Value: $920,849 - $1,185,000
3
Beds
2
Baths
1,120
Sq Ft
$952/Sq Ft
Est. Value
About This Home
This home is located at 27231 Miraflores, Mission Viejo, CA 92692 and is currently estimated at $1,065,962, approximately $951 per square foot. 27231 Miraflores is a home located in Orange County with nearby schools including Carl Hankey Middle School, Capistrano Valley High School, and Mission Montessori.
Ownership History
Date
Name
Owned For
Owner Type
Purchase Details
Closed on
Aug 11, 2020
Sold by
Boyette Jacqueline R
Bought by
Boyette Jacqueline R and The Jacqueline R Boyette Livin
Current Estimated Value
Home Financials for this Owner
Home Financials are based on the most recent Mortgage that was taken out on this home.
Original Mortgage
$233,000
Outstanding Balance
$206,687
Interest Rate
3%
Mortgage Type
New Conventional
Estimated Equity
$859,275
Purchase Details
Closed on
Aug 7, 2014
Sold by
Boyette Jacqueline R
Bought by
Boyette Jacqueline R and The Jacqueline R Boyette Living Trust
Purchase Details
Closed on
Aug 12, 1997
Sold by
Brian Southworth and Brian Dana
Bought by
Boyette Jacqueline R
Home Financials for this Owner
Home Financials are based on the most recent Mortgage that was taken out on this home.
Original Mortgage
$120,000
Interest Rate
7.54%
Create a Home Valuation Report for This Property
The Home Valuation Report is an in-depth analysis detailing your home's value as well as a comparison with similar homes in the area
Home Values in the Area
Average Home Value in this Area
Purchase History
| Date | Buyer | Sale Price | Title Company |
|---|---|---|---|
| Boyette Jacqueline R | -- | Western Resources Title Co | |
| Boyette Jacqueline R | -- | Western Resources Title Co | |
| Boyette Jacqueline R | -- | None Available | |
| Boyette Jacqueline R | $173,000 | Fidelity National Title Ins |
Source: Public Records
Mortgage History
| Date | Status | Borrower | Loan Amount |
|---|---|---|---|
| Open | Boyette Jacqueline R | $233,000 | |
| Previous Owner | Boyette Jacqueline R | $120,000 |
Source: Public Records
Tax History Compared to Growth
Tax History
| Year | Tax Paid | Tax Assessment Tax Assessment Total Assessment is a certain percentage of the fair market value that is determined by local assessors to be the total taxable value of land and additions on the property. | Land | Improvement |
|---|---|---|---|---|
| 2025 | $2,689 | $276,226 | $189,204 | $87,022 |
| 2024 | $2,689 | $270,810 | $185,494 | $85,316 |
| 2023 | $2,631 | $265,500 | $181,856 | $83,644 |
| 2022 | $2,580 | $260,295 | $178,291 | $82,004 |
| 2021 | $2,528 | $255,192 | $174,795 | $80,397 |
| 2020 | $2,503 | $252,576 | $173,003 | $79,573 |
| 2019 | $2,452 | $247,624 | $169,611 | $78,013 |
| 2018 | $2,404 | $242,769 | $166,285 | $76,484 |
| 2017 | $2,355 | $238,009 | $163,024 | $74,985 |
| 2016 | $2,309 | $233,343 | $159,828 | $73,515 |
| 2015 | $2,290 | $229,838 | $157,427 | $72,411 |
| 2014 | $2,244 | $225,336 | $154,343 | $70,993 |
Source: Public Records
Map
Nearby Homes
- 26998 El Retiro
- 27075 La Fuente
- 26732 Trasmiras
- 26848 Park Terrace Ln Unit 130
- 26896 Park Terrace Ln Unit 229
- 26766 Baronet
- 26611 Strafford
- 26611 Loma Verde
- 26972 Venado Dr
- 26646 Guadiana
- 26635 Guadiana
- 27533 Calinda
- 26562 Via Mondelo
- 26466 San Torini Rd
- 26516 El Mar Dr
- 26914 Jasper Unit 254
- 26611 Dorothea
- 26562 Lucinda
- 26982 Stonehaven Unit 77
- 26553 Lucinda
- 27241 Miraflores
- 27251 Miraflores
- 27212 Nogal
- 27216 Nogal
- 27232 Miraflores
- 27255 Miraflores
- 27222 Nogal
- 27242 Miraflores
- 27252 Miraflores
- 27261 Miraflores
- 27232 Nogal
- 27256 Miraflores
- 26962 El Retiro
- 27271 Miraflores
- 27234 Nogal
- 27201 Nogal
- 26925 Colmenar
- 26966 El Retiro
- 27221 Nogal
- 27275 Miraflores