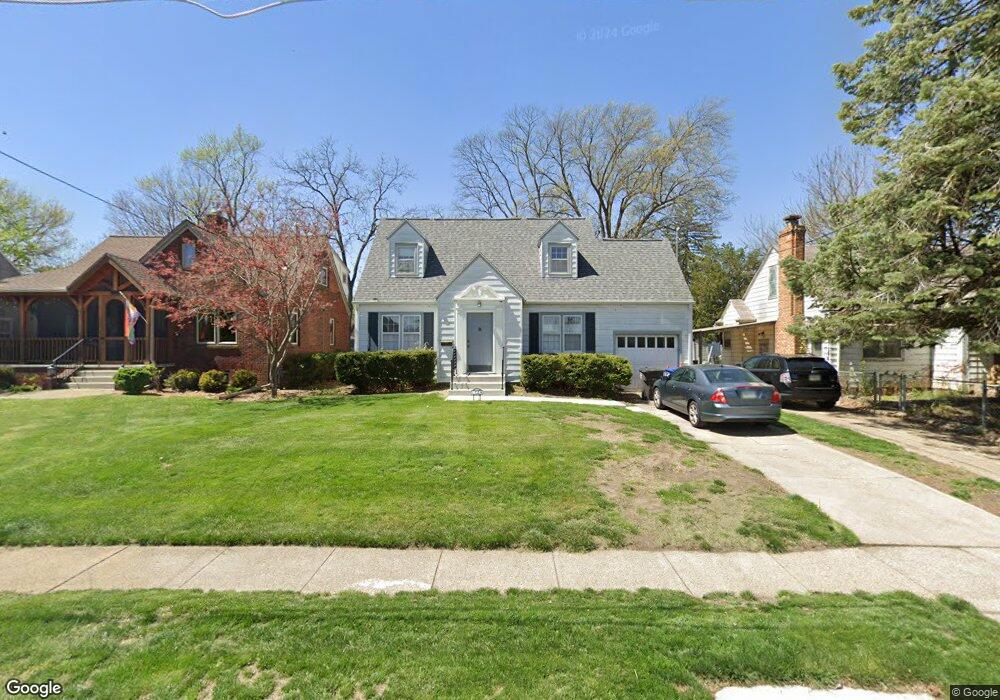
2724 41st Place Des Moines, IA 50310
Beaverdale NeighborhoodEstimated Value: $245,000 - $283,000
3
Beds
3
Baths
1,600
Sq Ft
$169/Sq Ft
Est. Value
About This Home
This home is located at 2724 41st Place, Des Moines, IA 50310 and is currently estimated at $270,900, approximately $169 per square foot. 2724 41st Place is a home located in Polk County with nearby schools including Hillis Elementary School, Meredith Middle School, and Hoover High School.
Ownership History
Date
Name
Owned For
Owner Type
Purchase Details
Closed on
Jan 10, 2000
Sold by
Wandro James P and Wandro Kelley J
Bought by
Mcelrath William W
Current Estimated Value
Home Financials for this Owner
Home Financials are based on the most recent Mortgage that was taken out on this home.
Original Mortgage
$109,800
Outstanding Balance
$34,450
Interest Rate
7.89%
Estimated Equity
$236,450
Create a Home Valuation Report for This Property
The Home Valuation Report is an in-depth analysis detailing your home's value as well as a comparison with similar homes in the area
Home Values in the Area
Average Home Value in this Area
Purchase History
| Date | Buyer | Sale Price | Title Company |
|---|---|---|---|
| Mcelrath William W | $121,500 | -- |
Source: Public Records
Mortgage History
| Date | Status | Borrower | Loan Amount |
|---|---|---|---|
| Open | Mcelrath William W | $109,800 |
Source: Public Records
Tax History Compared to Growth
Tax History
| Year | Tax Paid | Tax Assessment Tax Assessment Total Assessment is a certain percentage of the fair market value that is determined by local assessors to be the total taxable value of land and additions on the property. | Land | Improvement |
|---|---|---|---|---|
| 2025 | $4,104 | $242,100 | $55,700 | $186,400 |
| 2024 | $4,104 | $219,100 | $49,500 | $169,600 |
| 2023 | $4,256 | $219,100 | $49,500 | $169,600 |
| 2022 | $3,826 | $189,500 | $43,700 | $145,800 |
| 2021 | $2,552 | $172,500 | $43,700 | $128,800 |
| 2020 | $4,466 | $110,900 | $40,800 | $70,100 |
| 2019 | $4,168 | $181,100 | $40,800 | $140,300 |
| 2018 | $4,120 | $163,600 | $36,200 | $127,400 |
| 2017 | $3,768 | $163,600 | $36,200 | $127,400 |
| 2016 | $3,666 | $147,800 | $32,000 | $115,800 |
| 2015 | $3,666 | $147,800 | $32,000 | $115,800 |
| 2014 | $3,646 | $151,300 | $32,200 | $119,100 |
Source: Public Records
Map
Nearby Homes
- 2728 41st Place
- 2720 41st Place
- 2718 41st Place
- 2732 41st Place
- 4138 Urbandale Ave
- 2725 42nd St
- 2723 41st Place
- 2721 42nd St
- 2801 42nd St
- 4142 Urbandale Ave
- 2719 42nd St
- 2721 41st Place
- 2807 42nd St
- 2710 41st Place
- 2715 42nd St
- 2719 41st Place
- 2715 41st Place
- 2711 42nd St
- 2702 41st Place
- 2811 42nd St