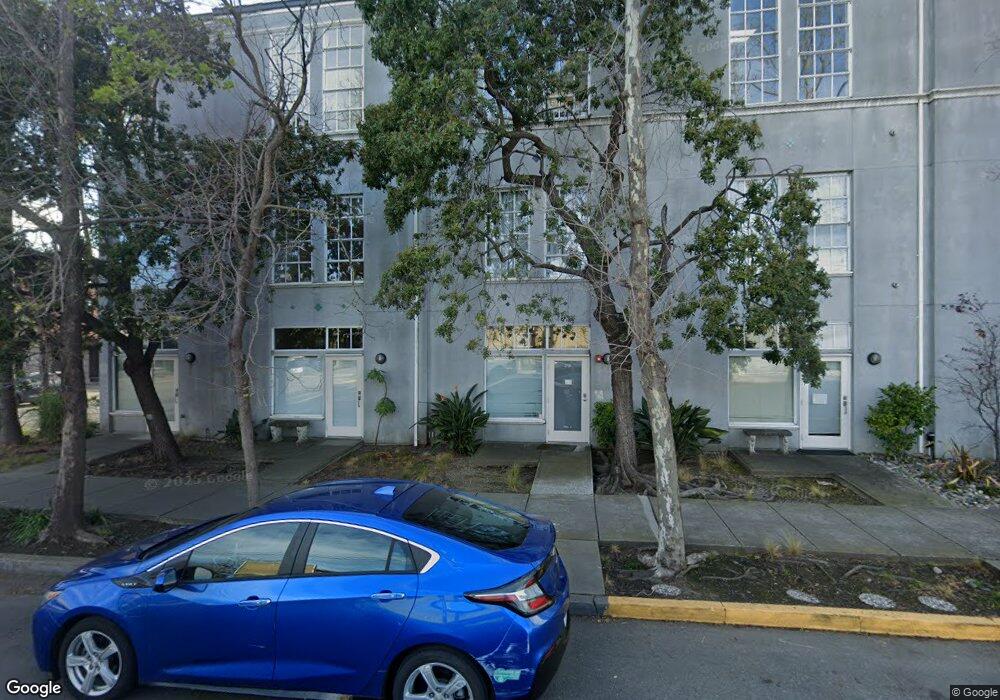
2724 9th St Unit 7 Berkeley, CA 94710
West Berkeley NeighborhoodEstimated Value: $665,001 - $995,000
1
Bed
1
Bath
1,323
Sq Ft
$623/Sq Ft
Est. Value
About This Home
This home is located at 2724 9th St Unit 7, Berkeley, CA 94710 and is currently estimated at $824,250, approximately $623 per square foot. 2724 9th St Unit 7 is a home located in Alameda County with nearby schools including Oxford Elementary School, Malcolm X Elementary School, and Washington Elementary School.
Ownership History
Date
Name
Owned For
Owner Type
Purchase Details
Closed on
Nov 6, 2017
Sold by
Nelson Gerald M
Bought by
Nelson Gerald M
Current Estimated Value
Purchase Details
Closed on
Aug 16, 2002
Sold by
Nelson Gerald M
Bought by
Nelson Gerald M
Home Financials for this Owner
Home Financials are based on the most recent Mortgage that was taken out on this home.
Original Mortgage
$137,000
Interest Rate
6.52%
Mortgage Type
Purchase Money Mortgage
Create a Home Valuation Report for This Property
The Home Valuation Report is an in-depth analysis detailing your home's value as well as a comparison with similar homes in the area
Home Values in the Area
Average Home Value in this Area
Purchase History
| Date | Buyer | Sale Price | Title Company |
|---|---|---|---|
| Nelson Gerald M | -- | None Available | |
| Nelson Gerald M | -- | American Title Co |
Source: Public Records
Mortgage History
| Date | Status | Borrower | Loan Amount |
|---|---|---|---|
| Closed | Nelson Gerald M | $137,000 |
Source: Public Records
Tax History
| Year | Tax Paid | Tax Assessment Tax Assessment Total Assessment is a certain percentage of the fair market value that is determined by local assessors to be the total taxable value of land and additions on the property. | Land | Improvement |
|---|---|---|---|---|
| 2025 | $7,639 | $409,059 | $86,679 | $329,380 |
| 2024 | $7,639 | $400,901 | $84,979 | $322,922 |
| 2023 | $7,464 | $399,904 | $83,313 | $316,591 |
| 2022 | $7,296 | $385,064 | $81,680 | $310,384 |
| 2021 | $7,291 | $377,376 | $80,078 | $304,298 |
| 2020 | $6,819 | $380,435 | $79,257 | $301,178 |
| 2019 | $6,463 | $372,976 | $77,703 | $295,273 |
| 2018 | $6,335 | $365,664 | $76,180 | $289,484 |
| 2017 | $6,100 | $358,494 | $74,686 | $283,808 |
| 2016 | $5,842 | $351,467 | $73,222 | $278,245 |
| 2015 | $5,755 | $346,190 | $72,123 | $274,067 |
| 2014 | $5,691 | $339,409 | $70,710 | $268,699 |
Source: Public Records
Map
Nearby Homes
- 1010 Grayson St
- 1034 Grayson St
- 2751 Wallace St
- 1092 Dwight Way
- 1118 Dwight Way
- 1142 Dwight Way
- 1144 Dwight Way
- 2717 Mabel St
- 2411 Sixth St
- 917 Channing Way
- 2341 9th St
- 1237 Ashby Ave
- 1039 Channing Way
- 2327 10th St Unit 4
- 811 Folger Ave
- 1314 Ashby Ave
- 2324 Browning St
- 3032 Mabel St
- 931 Bancroft Way
- 2241 Ninth St
Your Personal Tour Guide
Ask me questions while you tour the home.