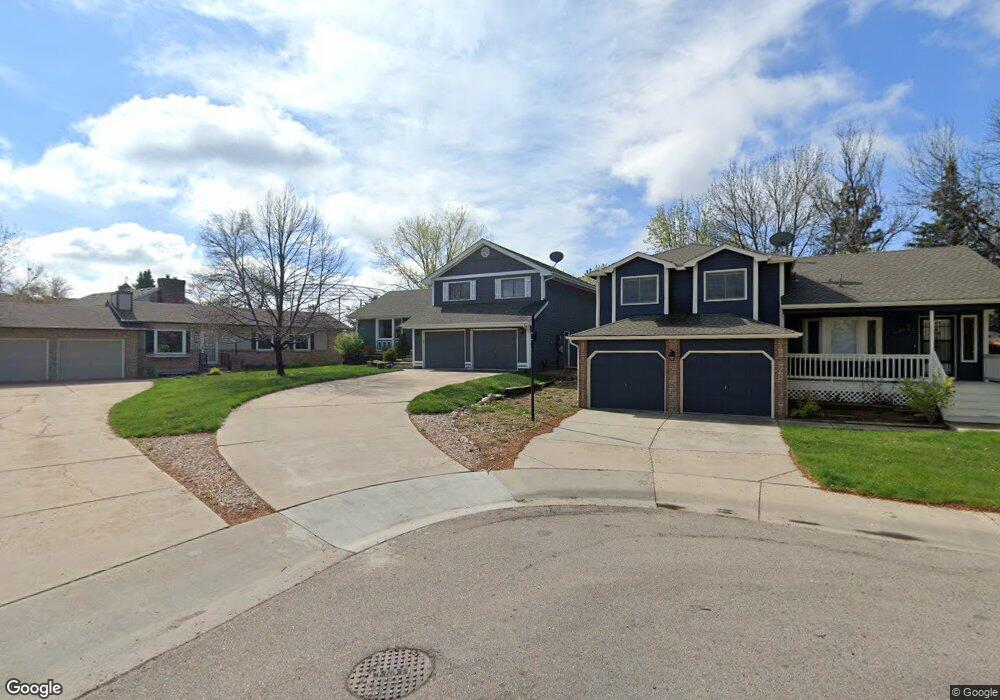
2726 Bradford Square Fort Collins, CO 80526
Estimated Value: $578,000 - $617,000
3
Beds
3
Baths
1,898
Sq Ft
$314/Sq Ft
Est. Value
About This Home
This home is located at 2726 Bradford Square, Fort Collins, CO 80526 and is currently estimated at $596,202, approximately $314 per square foot. 2726 Bradford Square is a home located in Larimer County with nearby schools including Bennett Elementary School, Blevins Middle School, and Rocky Mountain High School.
Ownership History
Date
Name
Owned For
Owner Type
Purchase Details
Closed on
Aug 22, 2011
Sold by
Fox Daniel N and Fox Karen A
Bought by
Mcgarvey Chad Justin and Vialpando Michelle
Current Estimated Value
Home Financials for this Owner
Home Financials are based on the most recent Mortgage that was taken out on this home.
Original Mortgage
$219,170
Outstanding Balance
$149,468
Interest Rate
4.25%
Mortgage Type
FHA
Estimated Equity
$446,734
Purchase Details
Closed on
May 21, 2003
Sold by
Daugherty Gene E and Daugherty Esther K
Bought by
Fox Daniel N and Fox Karen A
Home Financials for this Owner
Home Financials are based on the most recent Mortgage that was taken out on this home.
Original Mortgage
$168,000
Interest Rate
5.79%
Mortgage Type
Purchase Money Mortgage
Purchase Details
Closed on
Jun 1, 1993
Sold by
Patchen & Davis Properties
Bought by
Smith Joan
Purchase Details
Closed on
Oct 1, 1992
Sold by
Patchen Charles A
Bought by
Patchen & Davis Properties
Create a Home Valuation Report for This Property
The Home Valuation Report is an in-depth analysis detailing your home's value as well as a comparison with similar homes in the area
Home Values in the Area
Average Home Value in this Area
Purchase History
| Date | Buyer | Sale Price | Title Company |
|---|---|---|---|
| Mcgarvey Chad Justin | $237,000 | North Amer Title Co Of Co | |
| Fox Daniel N | $210,000 | Land Title | |
| Smith Joan | $101,900 | -- | |
| Patchen & Davis Properties | -- | -- |
Source: Public Records
Mortgage History
| Date | Status | Borrower | Loan Amount |
|---|---|---|---|
| Open | Mcgarvey Chad Justin | $219,170 | |
| Previous Owner | Fox Daniel N | $168,000 | |
| Closed | Fox Daniel N | $31,500 |
Source: Public Records
Tax History Compared to Growth
Tax History
| Year | Tax Paid | Tax Assessment Tax Assessment Total Assessment is a certain percentage of the fair market value that is determined by local assessors to be the total taxable value of land and additions on the property. | Land | Improvement |
|---|---|---|---|---|
| 2025 | $3,358 | $38,686 | $3,015 | $35,671 |
| 2024 | $3,195 | $38,686 | $3,015 | $35,671 |
| 2022 | $2,653 | $28,092 | $3,128 | $24,964 |
| 2021 | $2,681 | $28,901 | $3,218 | $25,683 |
| 2020 | $2,864 | $30,610 | $3,218 | $27,392 |
| 2019 | $2,876 | $30,610 | $3,218 | $27,392 |
| 2018 | $2,497 | $27,403 | $3,240 | $24,163 |
| 2017 | $2,489 | $27,403 | $3,240 | $24,163 |
| 2016 | $2,203 | $24,127 | $3,582 | $20,545 |
| 2015 | $2,187 | $24,120 | $3,580 | $20,540 |
| 2014 | $1,912 | $20,960 | $3,580 | $17,380 |
Source: Public Records
Map
Nearby Homes
- 2828 Silverplume Dr
- 2828 Silverplume Dr Unit R3
- 2738 Bradford Square
- 2718 Dunbar Ave
- 2918 Silverplume Dr Unit C1
- 2706 Dunbar Ave
- 1419 Glen Haven Dr
- 2855 Trenton Way
- 2109 W Drake Rd
- 1601 W Swallow Rd Unit 9
- 1601 W Swallow Rd Unit 1
- 1601 W Swallow Rd
- 1531 W Swallow Rd Unit 28
- 1531 W Swallow Rd Unit 25
- 1401 Sioux Blvd
- 1213 W Swallow Rd Unit 213
- 1231 W Swallow Rd Unit 316
- 1231 W Swallow Rd Unit 323
- 1231 W Swallow Rd Unit 314
- 2613 Hanover Dr
- 2720 Bradford Square
- 2732 Bradford Square
- 2714 Bradford Square
- 2762 Nottingham Square
- 2828 Silverplume Dr Unit I3
- 2828 Silverplume Dr Unit I2
- 2828 Silverplume Dr Unit I1
- 2828 Silverplume Dr Unit H6
- 2828 Silverplume Dr Unit H5
- 2828 Silverplume Dr Unit H4
- 2828 Silverplume Dr Unit H3
- 2828 Silverplume Dr Unit H2
- 2828 Silverplume Dr Unit H1
- 2828 Silverplume Dr Unit K5
- 2828 Silverplume Dr Unit K4
- 2828 Silverplume Dr Unit K3
- 2828 Silverplume Dr Unit K2
- 2828 Silverplume Dr Unit K1
- 2828 Silverplume Dr Unit J3
- 2828 Silverplume Dr Unit J2