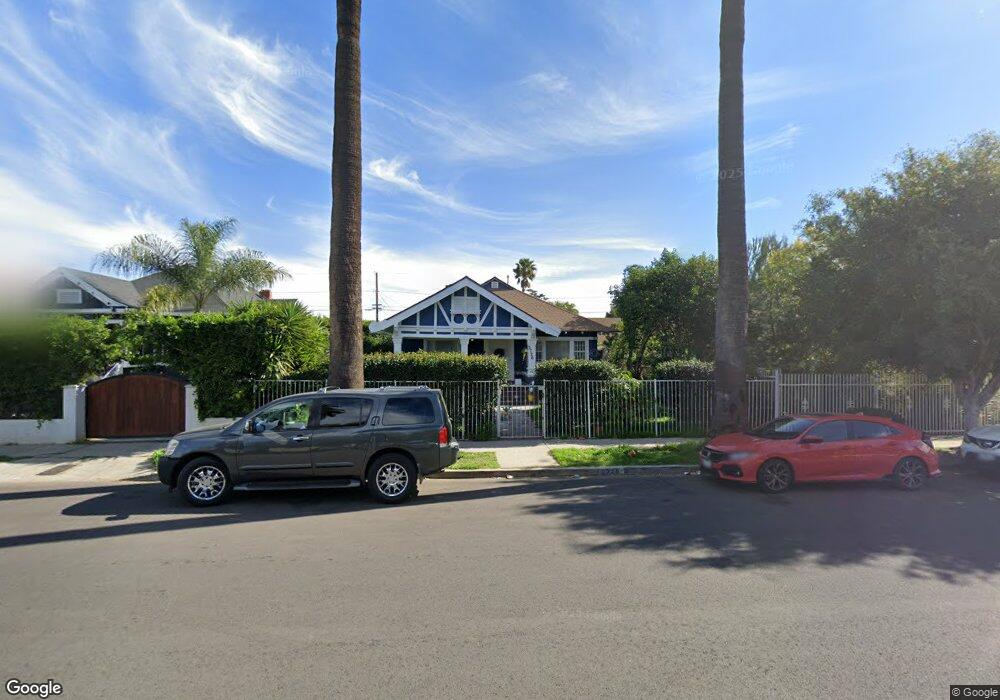
2726 Halldale Ave Los Angeles, CA 90018
Adams-Normandie NeighborhoodEstimated Value: $808,000 - $866,393
2
Beds
1
Bath
1,426
Sq Ft
$588/Sq Ft
Est. Value
About This Home
This home is located at 2726 Halldale Ave, Los Angeles, CA 90018 and is currently estimated at $839,098, approximately $588 per square foot. 2726 Halldale Ave is a home located in Los Angeles County with nearby schools including Vermont Avenue Elementary School, Johnnie L. Cochran Jr. Middle School, and West Adams Preparatory High School.
Ownership History
Date
Name
Owned For
Owner Type
Purchase Details
Closed on
Dec 1, 2006
Sold by
Williams David Bruce
Bought by
Williams Paula
Current Estimated Value
Home Financials for this Owner
Home Financials are based on the most recent Mortgage that was taken out on this home.
Original Mortgage
$250,000
Outstanding Balance
$150,049
Interest Rate
6.38%
Mortgage Type
New Conventional
Estimated Equity
$689,049
Purchase Details
Closed on
Nov 8, 2004
Sold by
Fenton Monica A
Bought by
Williams Paula
Purchase Details
Closed on
Feb 13, 1995
Sold by
The Fhl Financial Group
Bought by
Fenton Monica A
Home Financials for this Owner
Home Financials are based on the most recent Mortgage that was taken out on this home.
Original Mortgage
$100,000
Interest Rate
9.23%
Purchase Details
Closed on
Mar 1, 1994
Sold by
Fenton Monica A
Bought by
Fenton Monica
Home Financials for this Owner
Home Financials are based on the most recent Mortgage that was taken out on this home.
Original Mortgage
$112,500
Interest Rate
6.98%
Create a Home Valuation Report for This Property
The Home Valuation Report is an in-depth analysis detailing your home's value as well as a comparison with similar homes in the area
Home Values in the Area
Average Home Value in this Area
Purchase History
| Date | Buyer | Sale Price | Title Company |
|---|---|---|---|
| Williams Paula | -- | Progressive Title Company | |
| Williams Paula | -- | -- | |
| Fenton Monica A | $125,000 | First American Title Co | |
| Fenton Monica | -- | Gateway Title Company |
Source: Public Records
Mortgage History
| Date | Status | Borrower | Loan Amount |
|---|---|---|---|
| Open | Williams Paula | $250,000 | |
| Previous Owner | Fenton Monica A | $100,000 | |
| Previous Owner | Fenton Monica | $112,500 |
Source: Public Records
Tax History Compared to Growth
Tax History
| Year | Tax Paid | Tax Assessment Tax Assessment Total Assessment is a certain percentage of the fair market value that is determined by local assessors to be the total taxable value of land and additions on the property. | Land | Improvement |
|---|---|---|---|---|
| 2025 | $1,022 | $61,315 | $44,589 | $16,726 |
| 2024 | $1,022 | $60,114 | $43,715 | $16,399 |
| 2023 | $1,011 | $58,936 | $42,858 | $16,078 |
| 2022 | $977 | $57,781 | $42,018 | $15,763 |
| 2021 | $955 | $56,649 | $41,195 | $15,454 |
| 2019 | $933 | $54,971 | $39,974 | $14,997 |
| 2018 | $874 | $53,894 | $39,191 | $14,703 |
| 2016 | $825 | $51,803 | $37,670 | $14,133 |
| 2015 | $816 | $51,026 | $37,105 | $13,921 |
| 2014 | $832 | $50,028 | $36,379 | $13,649 |
Source: Public Records
Map
Nearby Homes
- 2801 Brighton Ave
- 2650 Halldale Ave
- 2648 Brighton Ave
- 2745 Kenwood Ave
- 2636 S Normandie Ave
- 2917 Kenwood Ave
- 2921 Kenwood Ave
- 2712 Kenwood Ave
- 2656 Kenwood Ave
- 2947 Dalton Ave
- 3005 S Normandie Ave
- 2936 S La Salle Ave
- 2817 S La Salle Ave
- 1881 W 27th St
- 2619 Raymond Ave
- 3100 Brighton Ave
- 1674 W 25th St
- 2945 Van Buren Place
- 1788 W 24th St
- 2955 Van Buren Place
- 2722 Halldale Ave
- 2802 Halldale Ave
- 2716 Halldale Ave
- 2806 Halldale Ave
- 2712 Halldale Ave
- 2812 Halldale Ave
- 2731 Brighton Ave
- 2727 Brighton Ave
- 2723 Brighton Ave
- 2807 Brighton Ave
- 2706 Halldale Ave
- 2816 Halldale Ave
- 2715 Brighton Ave Unit 15
- 2715 Brighton Ave
- 2711 Brighton Ave
- 2815 Brighton Ave
- 2822 Halldale Ave
- 2807 Halldale Ave
- 1770 W 27th St
- 1764 W 27th St