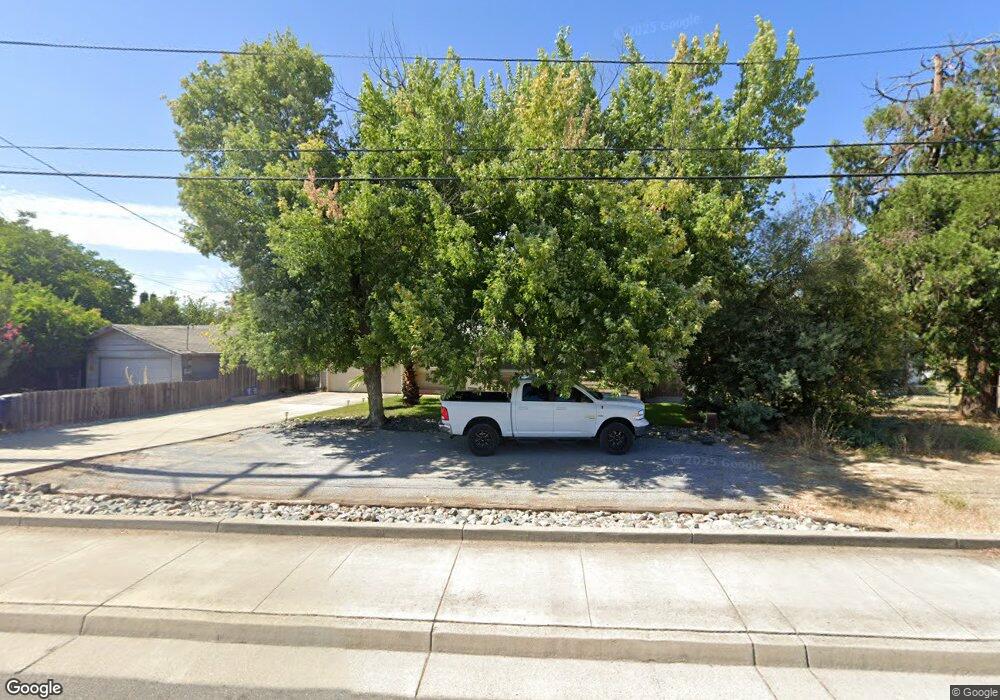
2726 S Bonnyview Rd Redding, CA 96001
Bonnyview NeighborhoodEstimated Value: $267,000 - $299,000
3
Beds
2
Baths
1,248
Sq Ft
$231/Sq Ft
Est. Value
About This Home
This home is located at 2726 S Bonnyview Rd, Redding, CA 96001 and is currently estimated at $288,039, approximately $230 per square foot. 2726 S Bonnyview Rd is a home located in Shasta County with nearby schools including Bonny View Elementary School, Sequoia Middle School, and Shasta High School.
Ownership History
Date
Name
Owned For
Owner Type
Purchase Details
Closed on
Mar 25, 2020
Sold by
Corrigan Heidi D
Bought by
Laroy Properties Llc
Current Estimated Value
Purchase Details
Closed on
Apr 3, 2019
Sold by
Corrigan Chris J
Bought by
Corrigan Heidi D
Purchase Details
Closed on
Mar 16, 2009
Sold by
Nationstar Mortgage Llc
Bought by
Corrigan Chris J and Corrigan Heidi D
Purchase Details
Closed on
Oct 7, 2008
Sold by
Harris Dennis Stuart and Moore Carrie J
Bought by
Nationstar Mortgage Llc
Purchase Details
Closed on
May 16, 2006
Sold by
Harris Dennis Stuart and Harris Allen Dean
Bought by
Harris Dennis Stuart and Moore Carrie J
Home Financials for this Owner
Home Financials are based on the most recent Mortgage that was taken out on this home.
Original Mortgage
$164,800
Interest Rate
7.12%
Mortgage Type
Fannie Mae Freddie Mac
Create a Home Valuation Report for This Property
The Home Valuation Report is an in-depth analysis detailing your home's value as well as a comparison with similar homes in the area
Home Values in the Area
Average Home Value in this Area
Purchase History
| Date | Buyer | Sale Price | Title Company |
|---|---|---|---|
| Laroy Properties Llc | -- | None Available | |
| Corrigan Heidi D | -- | None Available | |
| Corrigan Chris J | $117,000 | First American Title Ins Co | |
| Nationstar Mortgage Llc | $141,100 | Accommodation | |
| Harris Dennis Stuart | -- | Fidelity National Financial |
Source: Public Records
Mortgage History
| Date | Status | Borrower | Loan Amount |
|---|---|---|---|
| Previous Owner | Harris Dennis Stuart | $164,800 |
Source: Public Records
Tax History
| Year | Tax Paid | Tax Assessment Tax Assessment Total Assessment is a certain percentage of the fair market value that is determined by local assessors to be the total taxable value of land and additions on the property. | Land | Improvement |
|---|---|---|---|---|
| 2025 | $1,580 | $150,522 | $77,258 | $73,264 |
| 2024 | $1,555 | $147,572 | $75,744 | $71,828 |
| 2023 | $1,555 | $144,679 | $74,259 | $70,420 |
| 2022 | $1,529 | $141,843 | $72,803 | $69,040 |
| 2021 | $1,521 | $139,063 | $71,376 | $67,687 |
| 2020 | $1,541 | $137,638 | $70,645 | $66,993 |
| 2019 | $1,463 | $134,940 | $69,260 | $65,680 |
| 2018 | $1,476 | $132,295 | $67,902 | $64,393 |
| 2017 | $1,468 | $129,702 | $66,571 | $63,131 |
| 2016 | $1,422 | $127,160 | $65,266 | $61,894 |
| 2015 | $1,346 | $120,000 | $40,000 | $80,000 |
| 2014 | $1,308 | $115,000 | $35,000 | $80,000 |
Source: Public Records
Map
Nearby Homes
- 5875 Farm House Ln
- 5782 Old Barn Way
- 5855 Live Oak Ln
- 2381 S Bonnyview Rd
- 2339 North Dr
- 2850 Balaton Ave
- 2237 Jewell Ln
- 2890 Balaton Ave
- 3232 Nicolet Ln
- 5812 Cedars Rd Unit 43
- 5812 Cedars Rd Unit 13
- 5812 Cedars Rd Unit 36
- 5812 Cedars Rd Unit 3
- 2200 Jewell Ln
- 3500 Pioneer Ln
- 5367 Rosswood Ln
- 6405 El Camino Dr
- 0 Waverly Manor
- 2048 Wilder Dr
- 6551 El Camino Dr
- 2726 S Bonnyview Rd
- 2720 S Bonnyview Rd
- 2730 S Bonnyview Rd
- 2716 S Bonnyview Rd
- 5919 Reno Ln
- 5923 Reno Ln
- 5915 Reno Ln
- 5911 Reno Ln
- 2774 S Bonnyview Rd
- 5826 E Bonnyview Rd
- 5881 Reno Ln
- 5810 E Bonnyview Rd
- 5800 E Bonnyview Rd
- 5780 E Bonnyview Rd
- 5736 E Bonnyview Rd
- 5817 E Bonnyview Rd
- 5770 E Bonnyview Rd
- 5827 E Bonnyview Rd
- 3107 Barrel Ct
- 5861 Reno Ln
Your Personal Tour Guide
Ask me questions while you tour the home.