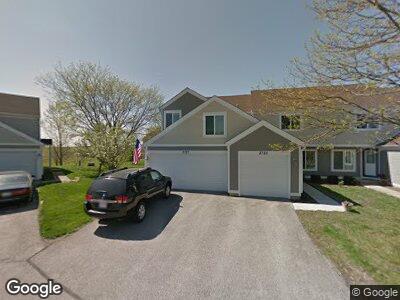
2727 Yorkshire Ct Unit 6 Aurora, IL 60502
Big Woods Marmion NeighborhoodEstimated Value: $260,000 - $287,059
3
Beds
2
Baths
1,480
Sq Ft
$185/Sq Ft
Est. Value
About This Home
This home is located at 2727 Yorkshire Ct Unit 6, Aurora, IL 60502 and is currently estimated at $273,765, approximately $184 per square foot. 2727 Yorkshire Ct Unit 6 is a home located in DuPage County with nearby schools including Gwendolyn Brooks Elementary School, Francis Granger Middle School, and Metea Valley High School.
Ownership History
Date
Name
Owned For
Owner Type
Purchase Details
Closed on
Jun 11, 2015
Sold by
Tennyson Terri Lyn and Tennyson Mark
Bought by
Tennyson Mark
Current Estimated Value
Purchase Details
Closed on
Sep 16, 2003
Sold by
Tennyson Mark A
Bought by
Tennyson Mark A and Tennyson Terri L
Home Financials for this Owner
Home Financials are based on the most recent Mortgage that was taken out on this home.
Original Mortgage
$118,000
Interest Rate
6.33%
Mortgage Type
Balloon
Purchase Details
Closed on
Sep 23, 2002
Sold by
Thiel Dorothy E
Bought by
Tennyson Mark A
Home Financials for this Owner
Home Financials are based on the most recent Mortgage that was taken out on this home.
Original Mortgage
$116,000
Interest Rate
6.39%
Purchase Details
Closed on
Oct 30, 1998
Sold by
Richsteig Edward M and Richsteig Beth A
Bought by
Thiel Dorothy E
Create a Home Valuation Report for This Property
The Home Valuation Report is an in-depth analysis detailing your home's value as well as a comparison with similar homes in the area
Home Values in the Area
Average Home Value in this Area
Purchase History
| Date | Buyer | Sale Price | Title Company |
|---|---|---|---|
| Tennyson Mark | -- | Attorney | |
| Tennyson Mark A | -- | Git | |
| Tennyson Mark A | $145,000 | Premier Title | |
| Thiel Dorothy E | $108,000 | Law Title Pick Up |
Source: Public Records
Mortgage History
| Date | Status | Borrower | Loan Amount |
|---|---|---|---|
| Open | Tennyson Mark | $115,000 | |
| Closed | Tennyson Mark A | $123,000 | |
| Closed | Tennyson Mark A | $129,600 | |
| Closed | Tennyson Mark A | $45,000 | |
| Closed | Tennyson Mark A | $25,000 | |
| Closed | Tennyson Mark A | $118,000 | |
| Closed | Tennyson Mark A | $116,000 | |
| Previous Owner | Thiel Dorothy E | $25,000 |
Source: Public Records
Tax History Compared to Growth
Tax History
| Year | Tax Paid | Tax Assessment Tax Assessment Total Assessment is a certain percentage of the fair market value that is determined by local assessors to be the total taxable value of land and additions on the property. | Land | Improvement |
|---|---|---|---|---|
| 2023 | $4,831 | $67,440 | $18,210 | $49,230 |
| 2022 | $4,628 | $61,190 | $16,400 | $44,790 |
| 2021 | $4,496 | $59,000 | $15,810 | $43,190 |
| 2020 | $4,551 | $59,000 | $15,810 | $43,190 |
| 2019 | $4,378 | $56,120 | $15,040 | $41,080 |
| 2018 | $3,362 | $44,060 | $11,990 | $32,070 |
| 2017 | $3,060 | $39,960 | $10,870 | $29,090 |
| 2016 | $2,791 | $36,180 | $9,840 | $26,340 |
| 2015 | $2,742 | $34,350 | $9,340 | $25,010 |
| 2014 | $2,505 | $31,140 | $8,400 | $22,740 |
| 2013 | $2,482 | $31,360 | $8,460 | $22,900 |
Source: Public Records
Map
Nearby Homes
- 2732 Wilshire Ct
- 2661 Prairieview Ln S Unit 4
- 2674 Stanton Ct S Unit 4
- 2513 Prairieview Ln S
- 2615 Prairieview Ln
- 2442 Wilton Ln Unit 5596
- 2611 Newton Ct
- 2449 Wydown Ln Unit 4
- 2463 Red Bud Ct
- 2364 Foxmoor Ln Unit 5401
- 2466 Sunlight Ct Unit 6
- 2490 Hedge Row Dr
- 2374 Handley Ln Unit 1
- 2747 Charter Oak Dr Unit 2
- 2723 Trojak Ln
- 2655 Molitor Rd
- 31W776 Molitor Rd
- 2793 Nicole Cir
- 2653 Clara Ave
- 1589 Stonehenge Ct
- 2727 Yorkshire Ct Unit 6
- 2725 Yorkshire Ct Unit 6
- 2723 Yorkshire Ct Unit 6
- 2731 Yorkshire Ct
- 2721 Yorkshire Ct Unit 6
- 2733 Yorkshire Ct Unit 6
- 2726 Preston Ct Unit 714
- 2724 Preston Ct Unit 7
- 2717 Yorkshire Ct
- 2735 Yorkshire Ct
- 2730 Preston Ct Unit 7
- 2722 Preston Ct Unit 712
- 2715 Yorkshire Ct Unit 6
- 2737 Yorkshire Ct Unit 6
- 2720 Preston Ct Unit 7
- 2720 Preston Ct Unit 2720
- 2720 Preston Ct Unit 2722
- 2732 Preston Ct Unit 7
- 2713 Yorkshire Ct Unit 6
- 2734 Preston Ct Unit 723