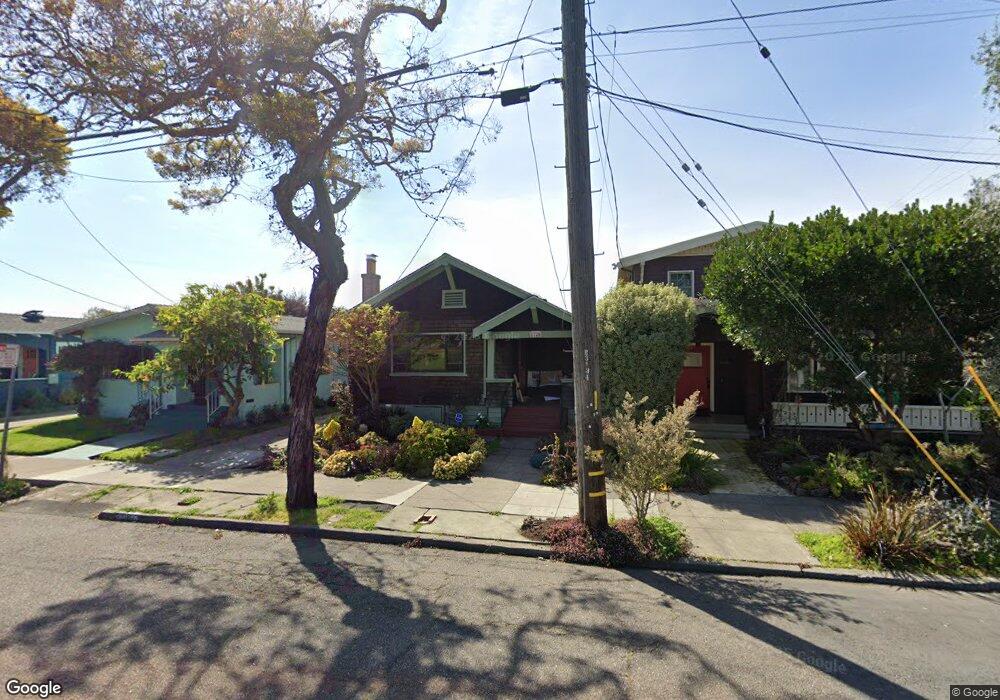
2728 Mabel St Berkeley, CA 94702
West Berkeley NeighborhoodEstimated Value: $904,000 - $1,004,286
2
Beds
1
Bath
1,011
Sq Ft
$943/Sq Ft
Est. Value
About This Home
This home is located at 2728 Mabel St, Berkeley, CA 94702 and is currently estimated at $953,572, approximately $943 per square foot. 2728 Mabel St is a home located in Alameda County with nearby schools including Malcolm X Elementary School, Oxford Elementary School, and Washington Elementary School.
Ownership History
Date
Name
Owned For
Owner Type
Purchase Details
Closed on
Dec 31, 1999
Sold by
Anna Levinson David H and Olivarez Levinso
Bought by
Levinson David H and Olivarez Levinson Ana I
Current Estimated Value
Purchase Details
Closed on
Feb 16, 1995
Sold by
Akins Diane Matthews
Bought by
Levinson David and Olivarez Anna I
Home Financials for this Owner
Home Financials are based on the most recent Mortgage that was taken out on this home.
Original Mortgage
$137,700
Interest Rate
6.87%
Create a Home Valuation Report for This Property
The Home Valuation Report is an in-depth analysis detailing your home's value as well as a comparison with similar homes in the area
Home Values in the Area
Average Home Value in this Area
Purchase History
| Date | Buyer | Sale Price | Title Company |
|---|---|---|---|
| Levinson David H | -- | -- | |
| Levinson David | $145,000 | Northwestern Title Company |
Source: Public Records
Mortgage History
| Date | Status | Borrower | Loan Amount |
|---|---|---|---|
| Previous Owner | Levinson David | $137,700 |
Source: Public Records
Tax History Compared to Growth
Tax History
| Year | Tax Paid | Tax Assessment Tax Assessment Total Assessment is a certain percentage of the fair market value that is determined by local assessors to be the total taxable value of land and additions on the property. | Land | Improvement |
|---|---|---|---|---|
| 2025 | $5,731 | $236,543 | $73,063 | $170,480 |
| 2024 | $5,731 | $231,768 | $71,630 | $167,138 |
| 2023 | $5,536 | $234,087 | $70,226 | $163,861 |
| 2022 | $5,341 | $222,498 | $68,849 | $160,649 |
| 2021 | $5,327 | $217,998 | $67,499 | $157,499 |
| 2020 | $5,000 | $222,691 | $66,807 | $155,884 |
| 2019 | $4,745 | $218,325 | $65,497 | $152,828 |
| 2018 | $4,633 | $214,045 | $64,213 | $149,832 |
| 2017 | $4,441 | $209,848 | $62,954 | $146,894 |
| 2016 | $4,239 | $205,735 | $61,720 | $144,015 |
| 2015 | $4,167 | $202,645 | $60,793 | $141,852 |
| 2014 | $4,106 | $198,677 | $59,603 | $139,074 |
Source: Public Records
Map
Nearby Homes
- 2703 Mathews St
- 2747 San Pablo Ave Unit 406
- 2747 San Pablo Ave Unit 217
- 1226 Russell St
- 1010 Grayson St
- 1342 Russell St
- 1450 Ward St
- 2758 Sacramento St
- 2774 Sacramento St
- 2782 Sacramento St
- 2790 Sacramento St
- 2750 Sacramento St
- 1118 Dwight Way
- 1314 Ashby Ave
- 2922 Stanton St
- 1092 Dwight Way
- 1431 Dwight Way
- 3032 Mabel St
- 1540 Stuart St
- 1516 Blake St