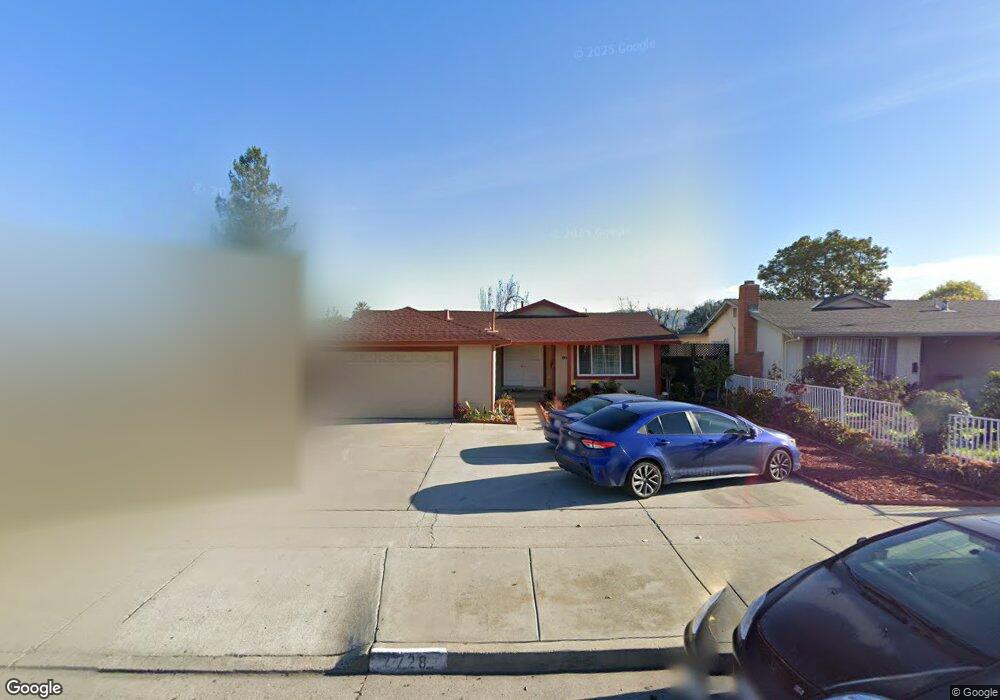
2728 Mclaughlin Ave San Jose, CA 95121
Stonegate NeighborhoodEstimated Value: $1,003,435 - $1,055,000
3
Beds
2
Baths
1,288
Sq Ft
$804/Sq Ft
Est. Value
About This Home
This home is located at 2728 Mclaughlin Ave, San Jose, CA 95121 and is currently estimated at $1,035,609, approximately $804 per square foot. 2728 Mclaughlin Ave is a home located in Santa Clara County with nearby schools including Windmill Springs Elementary School, Sylvandale Middle School, and Yerba Buena High School.
Ownership History
Date
Name
Owned For
Owner Type
Purchase Details
Closed on
Nov 18, 2021
Sold by
Vannguyen Thuyet and Bui Tai Ngoc
Bought by
Bui Tai Ngoc and Bui Van Nguyen
Current Estimated Value
Home Financials for this Owner
Home Financials are based on the most recent Mortgage that was taken out on this home.
Original Mortgage
$325,000
Outstanding Balance
$298,054
Interest Rate
3.05%
Mortgage Type
New Conventional
Estimated Equity
$737,555
Purchase Details
Closed on
Apr 8, 2014
Sold by
Vanvannguyen Thuyet Van
Bought by
Vanvannguyen Thuyet Van and Bui Tai Ngoc
Purchase Details
Closed on
May 21, 1998
Sold by
Duerksen Charlotte M and Duerksen E W
Bought by
Vannguyen Thuyet
Home Financials for this Owner
Home Financials are based on the most recent Mortgage that was taken out on this home.
Original Mortgage
$144,000
Interest Rate
7.13%
Create a Home Valuation Report for This Property
The Home Valuation Report is an in-depth analysis detailing your home's value as well as a comparison with similar homes in the area
Home Values in the Area
Average Home Value in this Area
Purchase History
| Date | Buyer | Sale Price | Title Company |
|---|---|---|---|
| Bui Tai Ngoc | -- | Chicago Title Company | |
| Vanvannguyen Thuyet Van | -- | None Available | |
| Vannguyen Thuyet | $224,000 | Chicago Title Co | |
| Vanvannguyen Thuyet Van | -- | Chicago Title Co |
Source: Public Records
Mortgage History
| Date | Status | Borrower | Loan Amount |
|---|---|---|---|
| Open | Bui Tai Ngoc | $325,000 | |
| Closed | Vannguyen Thuyet | $144,000 |
Source: Public Records
Tax History
| Year | Tax Paid | Tax Assessment Tax Assessment Total Assessment is a certain percentage of the fair market value that is determined by local assessors to be the total taxable value of land and additions on the property. | Land | Improvement |
|---|---|---|---|---|
| 2025 | $6,026 | $357,645 | $159,665 | $197,980 |
| 2024 | $6,026 | $350,634 | $156,535 | $194,099 |
| 2023 | $5,924 | $343,760 | $153,466 | $190,294 |
| 2022 | $5,799 | $337,020 | $150,457 | $186,563 |
| 2021 | $5,733 | $330,412 | $147,507 | $182,905 |
| 2020 | $5,498 | $327,025 | $145,995 | $181,030 |
| 2019 | $5,271 | $320,614 | $143,133 | $177,481 |
| 2018 | $5,250 | $314,328 | $140,327 | $174,001 |
| 2017 | $5,176 | $308,166 | $137,576 | $170,590 |
| 2016 | $4,921 | $302,125 | $134,879 | $167,246 |
| 2015 | $4,819 | $297,587 | $132,853 | $164,734 |
| 2014 | $4,365 | $291,759 | $130,251 | $161,508 |
Source: Public Records
Map
Nearby Homes
- 2690 Mclaughlin Ave
- 2739 Mclaughlin Ave
- 1079 Drexel Way
- 2825 Aetna Way
- 1314 Pellier Ct
- 1322 Becket Dr
- 2582 Tosca Way
- 2372 Balme Dr
- 3016 Shadow Springs Place Unit 113
- 2315 Warfield Way Unit B
- 2600 Senter Rd Unit 50
- 2600 Senter Rd Unit 121
- 2697 Lone Bluff Way
- 2701 Lone Bluff Way Unit 18
- 3241 Shadow Park Place
- 3135 Oakbridge Dr Unit 3135
- 2269 Warfield Way Unit A
- 2580 Senter Rd Unit 515
- 2252 Denair Ave
- 645 Dadis Way
- 2724 Mclaughlin Ave
- 2730 Mclaughlin Ave
- 2735 Eulalie Dr
- 2732 Mclaughlin Ave
- 2722 Mclaughlin Ave
- 2731 Eulalie Dr
- 2739 Eulalie Dr
- 2727 Eulalie Dr
- 2741 Eulalie Dr
- 2734 Mclaughlin Ave
- 2718 Mclaughlin Ave
- 2723 Eulalie Dr
- 2743 Eulalie Dr
- 2727 Mclaughlin Ave
- 2731 Mclaughlin Ave
- 2738 Mclaughlin Ave
- 2714 Mclaughlin Ave
- 2734 Eulalie Dr
- 2719 Eulalie Dr
- 2735 Mclaughlin Ave
Your Personal Tour Guide
Ask me questions while you tour the home.