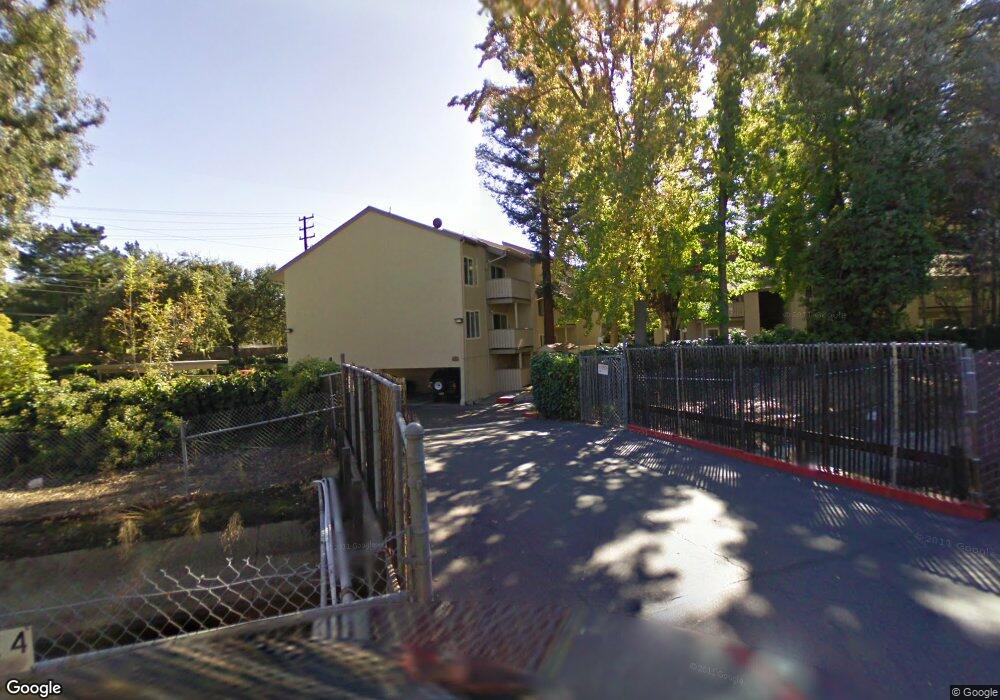
2728 Oak Rd Unit 150 Walnut Creek, CA 94597
Contra Costa Centre NeighborhoodEstimated Value: $396,812 - $450,000
2
Beds
1
Bath
879
Sq Ft
$482/Sq Ft
Est. Value
About This Home
This home is located at 2728 Oak Rd Unit 150, Walnut Creek, CA 94597 and is currently estimated at $423,703, approximately $482 per square foot. 2728 Oak Rd Unit 150 is a home located in Contra Costa County with nearby schools including Indian Valley Elementary School, Walnut Creek Intermediate School, and Las Lomas High School.
Ownership History
Date
Name
Owned For
Owner Type
Purchase Details
Closed on
Oct 2, 2020
Sold by
Chapman Scott C and Chapman Katherine Irvin
Bought by
Chapman Katherine I and Chapman Katherine Irvin
Current Estimated Value
Purchase Details
Closed on
Oct 6, 2003
Sold by
Irvin George and Irvin Elinor
Bought by
Irvin George H and Irvin Elinor Jane Ericksen
Purchase Details
Closed on
Sep 21, 1999
Sold by
Susan Wilson Bette and Wilson Bette Susan
Bought by
Irvin George and Irvin Elinor
Home Financials for this Owner
Home Financials are based on the most recent Mortgage that was taken out on this home.
Original Mortgage
$58,500
Outstanding Balance
$17,703
Interest Rate
8.09%
Mortgage Type
Stand Alone First
Estimated Equity
$406,000
Purchase Details
Closed on
Jul 21, 1999
Sold by
Nelson Darrell E
Bought by
Wilson Nelson Bette Susan
Create a Home Valuation Report for This Property
The Home Valuation Report is an in-depth analysis detailing your home's value as well as a comparison with similar homes in the area
Home Values in the Area
Average Home Value in this Area
Purchase History
| Date | Buyer | Sale Price | Title Company |
|---|---|---|---|
| Chapman Katherine I | -- | None Available | |
| Chapman Scott C | -- | None Available | |
| Irvin George H | -- | -- | |
| Irvin George | $132,000 | Placer Title Company | |
| Wilson Nelson Bette Susan | -- | Placer Title Company |
Source: Public Records
Mortgage History
| Date | Status | Borrower | Loan Amount |
|---|---|---|---|
| Open | Irvin George | $58,500 |
Source: Public Records
Tax History Compared to Growth
Tax History
| Year | Tax Paid | Tax Assessment Tax Assessment Total Assessment is a certain percentage of the fair market value that is determined by local assessors to be the total taxable value of land and additions on the property. | Land | Improvement |
|---|---|---|---|---|
| 2025 | $3,278 | $202,853 | $69,151 | $133,702 |
| 2024 | $3,201 | $198,877 | $67,796 | $131,081 |
| 2023 | $3,201 | $194,978 | $66,467 | $128,511 |
| 2022 | $3,183 | $191,156 | $65,164 | $125,992 |
| 2021 | $3,097 | $187,409 | $63,887 | $123,522 |
| 2019 | $3,005 | $181,852 | $61,993 | $119,859 |
| 2018 | $2,920 | $178,287 | $60,778 | $117,509 |
| 2017 | $2,852 | $174,792 | $59,587 | $115,205 |
| 2016 | $2,783 | $171,366 | $58,419 | $112,947 |
| 2015 | $2,719 | $168,793 | $57,542 | $111,251 |
| 2014 | $2,679 | $165,487 | $56,415 | $109,072 |
Source: Public Records
Map
Nearby Homes
- 2724 Oak Rd Unit 88
- 2704 Oak Rd Unit 80
- 2716 Oak Rd Unit 117
- 2716 Oak Rd Unit 111
- 2708 Oak Rd Unit 9
- 2712 Oak Rd Unit 57
- 2712 Oak Rd Unit 60
- 2709 Oak Rd Unit H
- 2592 Oak Rd Unit 160
- 178 Oak Cir
- Plan 4X at Oak Grove
- Plan 6 at Oak Grove
- Plan 3 at Oak Grove
- Plan 5 at Oak Grove
- Plan 6X at Oak Grove
- Plan 5X at Oak Grove
- 2578 Oak Rd Unit 212
- 2735 Oak Rd
- 225 Oak Cir
- 231 Oak Cir
- 2728 Oak Rd
- 2728 Oak Rd Unit 137
- 2728 Oak Rd Unit 151
- 2728 Oak Rd Unit 149
- 2728 Oak Rd Unit 148
- 2728 Oak Rd Unit 147
- 2728 Oak Rd Unit 146
- 2728 Oak Rd Unit 145
- 2728 Oak Rd Unit 144
- 2728 Oak Rd Unit 143
- 2728 Oak Rd Unit 142
- 2728 Oak Rd Unit 141
- 2728 Oak Rd Unit 140
- 2728 Oak Rd Unit 139
- 2728 Oak Rd Unit 138
- 2724 Oak Rd Unit 93
- 2724 Oak Rd Unit 92
- 2724 Oak Rd Unit 91
- 2724 Oak Rd Unit 90
- 2724 Oak Rd Unit 89