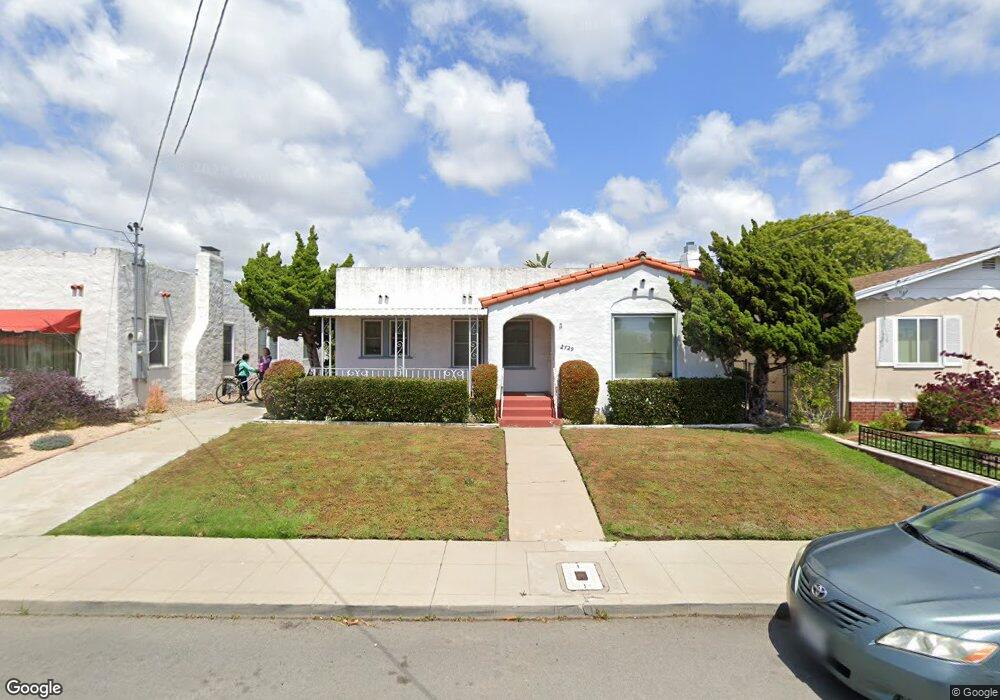
2729 Boundary St San Diego, CA 92104
North Park NeighborhoodEstimated Value: $1,167,262 - $1,489,000
3
Beds
2
Baths
1,529
Sq Ft
$847/Sq Ft
Est. Value
About This Home
This home is located at 2729 Boundary St, San Diego, CA 92104 and is currently estimated at $1,295,066, approximately $847 per square foot. 2729 Boundary St is a home located in San Diego County with nearby schools including McKinley Elementary School, Roosevelt International Middle School, and Mcgill School Of Success.
Ownership History
Date
Name
Owned For
Owner Type
Purchase Details
Closed on
Mar 26, 2002
Sold by
Mcclish Glen and Mcclish Jacqueline
Bought by
Mcclish Glen and Mcclish Jacqueline Bacon
Current Estimated Value
Purchase Details
Closed on
Oct 23, 2000
Sold by
Kleppinger John L
Bought by
Mcclish Glen and Mcclish Jacqueline
Purchase Details
Closed on
Jan 22, 1993
Create a Home Valuation Report for This Property
The Home Valuation Report is an in-depth analysis detailing your home's value as well as a comparison with similar homes in the area
Home Values in the Area
Average Home Value in this Area
Purchase History
| Date | Buyer | Sale Price | Title Company |
|---|---|---|---|
| Mcclish Glen | -- | -- | |
| Mcclish Glen | $372,500 | Commonwealth Land Title Co | |
| -- | $190,000 | -- |
Source: Public Records
Tax History Compared to Growth
Tax History
| Year | Tax Paid | Tax Assessment Tax Assessment Total Assessment is a certain percentage of the fair market value that is determined by local assessors to be the total taxable value of land and additions on the property. | Land | Improvement |
|---|---|---|---|---|
| 2025 | $6,739 | $561,279 | $376,701 | $184,578 |
| 2024 | $6,739 | $550,274 | $369,315 | $180,959 |
| 2023 | $6,587 | $539,485 | $362,074 | $177,411 |
| 2022 | $6,410 | $528,908 | $354,975 | $173,933 |
| 2021 | $6,363 | $518,538 | $348,015 | $170,523 |
| 2020 | $6,285 | $513,222 | $344,447 | $168,775 |
| 2019 | $6,171 | $503,160 | $337,694 | $165,466 |
| 2018 | $5,769 | $493,295 | $331,073 | $162,222 |
| 2017 | $5,631 | $483,624 | $324,582 | $159,042 |
| 2016 | $5,539 | $474,142 | $318,218 | $155,924 |
| 2015 | $5,456 | $467,021 | $313,439 | $153,582 |
| 2014 | $5,369 | $457,874 | $307,300 | $150,574 |
Source: Public Records
Map
Nearby Homes
- 3483 Olive St Unit 85
- 2661 Montclair St
- 2685 Montclair St
- 2609 Montclair St Unit 11
- 3606 Maple St Unit 12
- 2735-37 Teresita St
- 3005 Vancouver Ave
- 2541 Haller St
- 2280-82 Pentuckett Ave
- 2438 33rd St
- 2382 Haller St
- 2170 Montclair St
- 2929 32nd St
- 2429 32nd St
- 2211 Bancroft St
- 3322 Nile St
- 3129 Redwood St
- 2035 Haller St
- 2475 Capitan Ave
- 3440 Fir St
- 2667 Boundary St
- 2735 Boundary St
- 3519 Cooper St
- 2657 Boundary St
- 2745 Boundary St
- 3527 Cooper St
- 2649 Boundary St
- 3491 Cooper St
- 2674 Montclair St
- 2680 Montclair St
- 2668 Montclair St Unit 70
- 2670 Montclair St
- 3531 Cooper St Unit 33
- 2662 Montclair St
- 2660 Montclair St
- 3481 Cooper St
- 2643 Boundary St Unit 45
- 2638 Boundary St
- 2803 Boundary St
- 2658 Montclair St