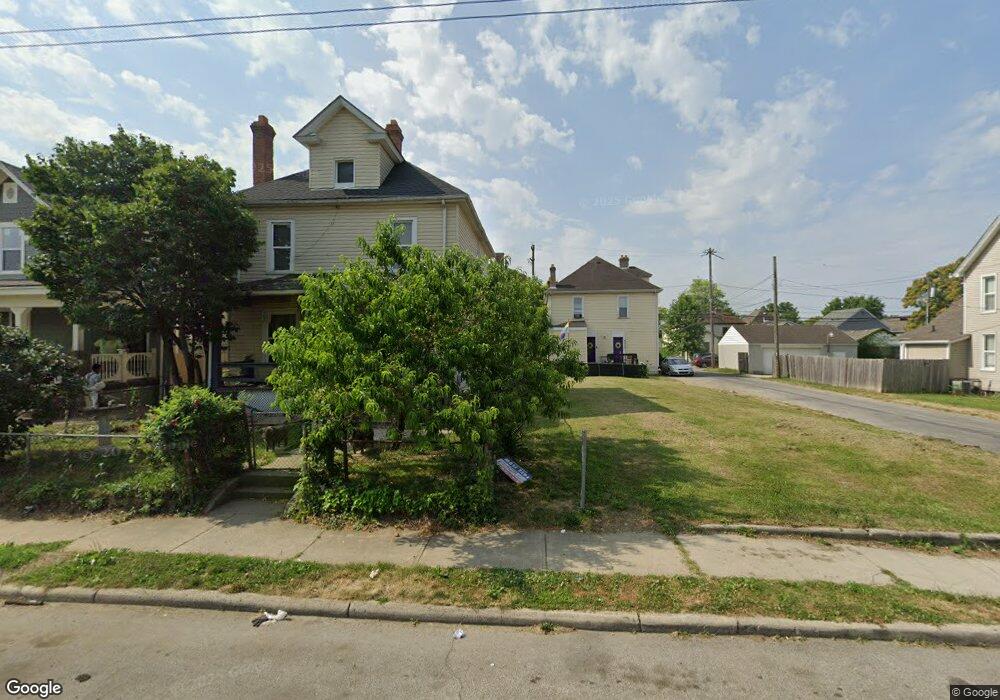
273 E Innis Ave Unit 275 Columbus, OH 43207
Reeb-Hosack/Hungarian Village NeighborhoodEstimated Value: $176,000 - $198,000
3
Beds
2
Baths
1,676
Sq Ft
$109/Sq Ft
Est. Value
About This Home
This home is located at 273 E Innis Ave Unit 275, Columbus, OH 43207 and is currently estimated at $182,276, approximately $108 per square foot. 273 E Innis Ave Unit 275 is a home located in Franklin County with nearby schools including Southwood Elementary School, South High School, and Saint Mary School German Village .
Ownership History
Date
Name
Owned For
Owner Type
Purchase Details
Closed on
Mar 31, 2025
Sold by
1820 Eighth Lp
Bought by
1820 South Eighth Street Llc
Current Estimated Value
Purchase Details
Closed on
Oct 29, 2024
Sold by
Chatham Partners Llc
Bought by
1820 Eighth Lp
Purchase Details
Closed on
Sep 11, 2015
Sold by
Jtm Rentals Iii Llc
Bought by
Chatham Partners Llc
Home Financials for this Owner
Home Financials are based on the most recent Mortgage that was taken out on this home.
Original Mortgage
$39,000
Interest Rate
3.93%
Mortgage Type
Purchase Money Mortgage
Purchase Details
Closed on
May 19, 2010
Sold by
Meek Rentals Iii Limited Partnership
Bought by
Jtm Rentals Iii Llc
Purchase Details
Closed on
Dec 3, 1992
Bought by
Meeks Rentals Iii L P
Purchase Details
Closed on
Oct 5, 1988
Purchase Details
Closed on
Sep 23, 1988
Create a Home Valuation Report for This Property
The Home Valuation Report is an in-depth analysis detailing your home's value as well as a comparison with similar homes in the area
Home Values in the Area
Average Home Value in this Area
Purchase History
| Date | Buyer | Sale Price | Title Company |
|---|---|---|---|
| 1820 South Eighth Street Llc | -- | None Listed On Document | |
| 1820 Eighth Lp | $173,500 | Columbus Title | |
| Chatham Partners Llc | $40,000 | Attorney | |
| Jtm Rentals Iii Llc | -- | Attorney | |
| Meeks Rentals Iii L P | -- | -- | |
| -- | $14,000 | -- | |
| -- | $21,000 | -- |
Source: Public Records
Mortgage History
| Date | Status | Borrower | Loan Amount |
|---|---|---|---|
| Previous Owner | Chatham Partners Llc | $39,000 |
Source: Public Records
Tax History Compared to Growth
Tax History
| Year | Tax Paid | Tax Assessment Tax Assessment Total Assessment is a certain percentage of the fair market value that is determined by local assessors to be the total taxable value of land and additions on the property. | Land | Improvement |
|---|---|---|---|---|
| 2024 | $5,555 | $59,510 | $17,400 | $42,110 |
| 2023 | $2,693 | $59,500 | $17,395 | $42,105 |
| 2022 | $1,396 | $17,500 | $4,130 | $13,370 |
| 2021 | $932 | $17,500 | $4,130 | $13,370 |
| 2020 | $933 | $17,500 | $4,130 | $13,370 |
| 2019 | $1,088 | $17,500 | $4,130 | $13,370 |
| 2018 | $2,054 | $24,150 | $4,130 | $20,020 |
| 2017 | $2,437 | $39,200 | $4,130 | $35,070 |
| 2016 | $1,838 | $27,060 | $3,430 | $23,630 |
| 2015 | $1,674 | $27,060 | $3,430 | $23,630 |
| 2014 | $1,678 | $27,060 | $3,430 | $23,630 |
| 2013 | $872 | $28,490 | $3,605 | $24,885 |
Source: Public Records
Map
Nearby Homes
- 1756 Bruck St
- 292 E Barthman Ave
- 255 E Woodrow Ave
- 238 E Barthman Ave
- 1808 S 6th St Unit 810
- 314 E Woodrow Ave
- 319 E Barthman Ave
- 259 Hinkle Ave
- 332 E Hinman Ave
- 160 E Barthman Ave
- 308 Hosack St
- 457 E Woodrow Ave Unit 459
- 92 E Innis Ave
- 129 E Hinman Ave
- 1613 S 8th St
- 1696 Parsons Ave
- 1692 Parsons Ave
- 59 E Innis Ave
- 1676 Parsons Ave
- 464 E Hinman Ave
- 277 E Innis Ave
- 265 E Innis Ave
- 213 E Innis Ave
- 287 E Innis Ave
- 255 E Innis Ave
- 291 E Innis Ave
- 295 E Innis Ave
- 251 E Innis Ave
- 274 E Innis Ave
- 260 Reeb Ave
- 299 E Innis Ave
- 256 Reeb Ave
- 288 E Innis Ave Unit 290
- 264 E Innis Ave
- 247 E Innis Ave
- 292 E Innis Ave
- 0 Reeb Ave
- 296 E Innis Ave
- 260 E Innis Ave
- 241 E Innis Ave