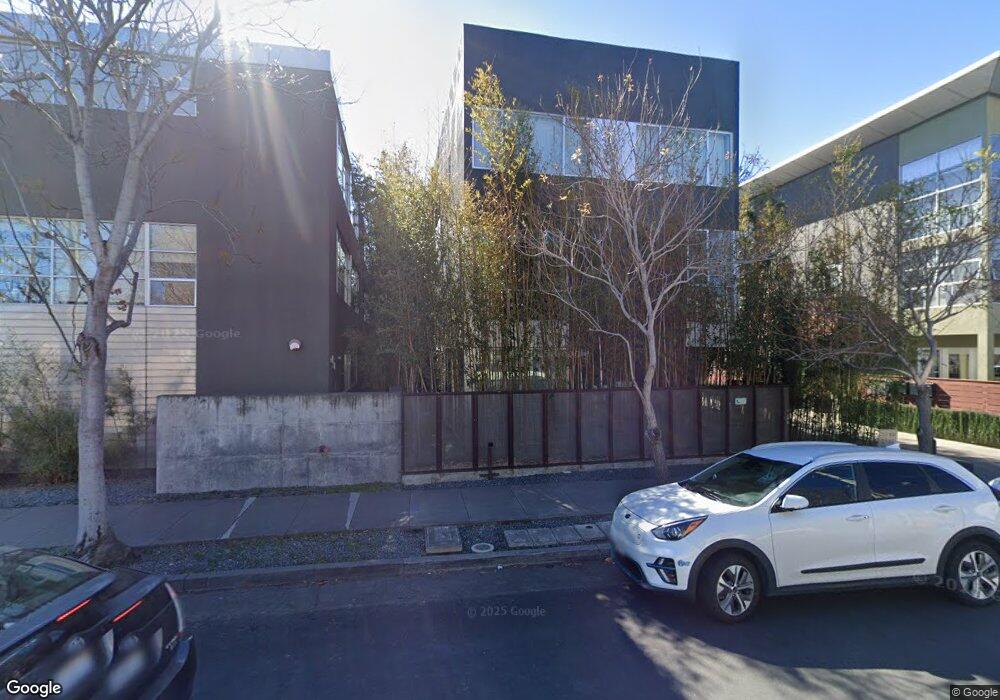
2730 8th St Berkeley, CA 94710
West Berkeley NeighborhoodEstimated Value: $963,983 - $1,311,000
2
Beds
3
Baths
1,550
Sq Ft
$720/Sq Ft
Est. Value
About This Home
This home is located at 2730 8th St, Berkeley, CA 94710 and is currently estimated at $1,116,746, approximately $720 per square foot. 2730 8th St is a home located in Alameda County with nearby schools including Oxford Elementary School, Malcolm X Elementary School, and Washington Elementary School.
Ownership History
Date
Name
Owned For
Owner Type
Purchase Details
Closed on
Aug 3, 2005
Sold by
Kava Massih Llc
Bought by
Kava Massih Llc
Current Estimated Value
Create a Home Valuation Report for This Property
The Home Valuation Report is an in-depth analysis detailing your home's value as well as a comparison with similar homes in the area
Home Values in the Area
Average Home Value in this Area
Purchase History
| Date | Buyer | Sale Price | Title Company |
|---|---|---|---|
| Kava Massih Llc | -- | Old Republic Title Company |
Source: Public Records
Tax History
| Year | Tax Paid | Tax Assessment Tax Assessment Total Assessment is a certain percentage of the fair market value that is determined by local assessors to be the total taxable value of land and additions on the property. | Land | Improvement |
|---|---|---|---|---|
| 2025 | $13,289 | $860,868 | $258,260 | $602,608 |
| 2024 | $13,289 | $843,991 | $253,197 | $590,794 |
| 2023 | $13,014 | $827,447 | $248,234 | $579,213 |
| 2022 | $12,779 | $811,225 | $243,367 | $567,858 |
| 2021 | $12,810 | $795,324 | $238,597 | $556,727 |
| 2020 | $12,112 | $787,171 | $236,151 | $551,020 |
| 2019 | $11,626 | $771,743 | $231,523 | $540,220 |
| 2018 | $11,431 | $756,617 | $226,985 | $529,632 |
| 2017 | $11,040 | $741,787 | $222,536 | $519,251 |
| 2016 | $10,682 | $727,246 | $218,174 | $509,072 |
| 2015 | $10,539 | $716,328 | $214,898 | $501,430 |
| 2014 | $9,192 | $600,000 | $180,000 | $420,000 |
Source: Public Records
Map
Nearby Homes
- 1010 Grayson St
- 1034 Grayson St
- 1092 Dwight Way
- 2751 Wallace St
- 1118 Dwight Way
- 2411 Sixth St
- 1142 Dwight Way
- 1144 Dwight Way
- 917 Channing Way
- 2341 9th St
- 2717 Mabel St
- 1039 Channing Way
- 2327 10th St Unit 4
- 1237 Ashby Ave
- 811 Folger Ave
- 931 Bancroft Way
- 2238 7th St
- 2241 Ninth St
- 2324 Browning St
- 2220 7th St
Your Personal Tour Guide
Ask me questions while you tour the home.