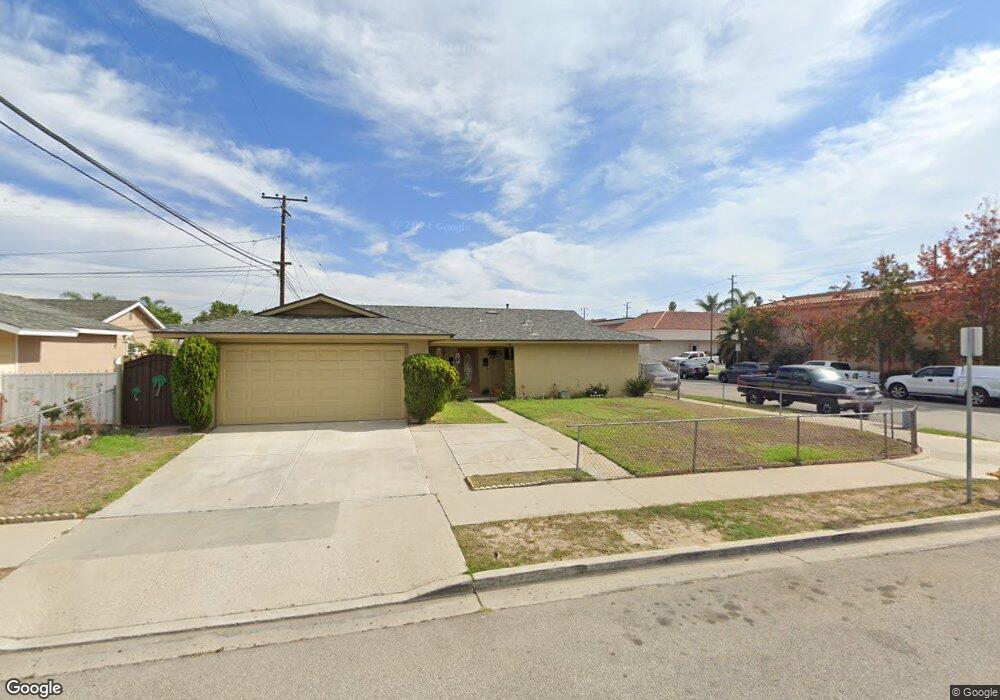
2730 Trinity Place Oxnard, CA 93033
Lemonwood Eastmont NeighborhoodEstimated Value: $601,000 - $690,000
4
Beds
2
Baths
1,208
Sq Ft
$533/Sq Ft
Est. Value
About This Home
This home is located at 2730 Trinity Place, Oxnard, CA 93033 and is currently estimated at $644,321, approximately $533 per square foot. 2730 Trinity Place is a home located in Ventura County with nearby schools including Lemonwood Elementary School and R.J. Frank Academy of Marine Science & Engineering.
Ownership History
Date
Name
Owned For
Owner Type
Purchase Details
Closed on
Oct 25, 2002
Sold by
Valdez Jesus D and Diaz Leticia S
Bought by
Valdez Jesus D and Diaz Leticia S
Current Estimated Value
Home Financials for this Owner
Home Financials are based on the most recent Mortgage that was taken out on this home.
Original Mortgage
$150,000
Outstanding Balance
$62,690
Interest Rate
5.99%
Estimated Equity
$581,631
Purchase Details
Closed on
Apr 2, 1999
Sold by
Bank Mellon
Bought by
Valdez Jesus D and Valdez Leticia S
Home Financials for this Owner
Home Financials are based on the most recent Mortgage that was taken out on this home.
Original Mortgage
$153,375
Interest Rate
6.98%
Mortgage Type
FHA
Purchase Details
Closed on
Dec 18, 1998
Sold by
Rudy Delpilar and Jose Johnny
Bought by
Mellon Bank
Create a Home Valuation Report for This Property
The Home Valuation Report is an in-depth analysis detailing your home's value as well as a comparison with similar homes in the area
Home Values in the Area
Average Home Value in this Area
Purchase History
| Date | Buyer | Sale Price | Title Company |
|---|---|---|---|
| Valdez Jesus D | -- | Fidelity National Title Co | |
| Valdez Jesus D | $160,000 | First American Title Ins Co | |
| Mellon Bank | $138,494 | Fidelity National Title Ins |
Source: Public Records
Mortgage History
| Date | Status | Borrower | Loan Amount |
|---|---|---|---|
| Open | Valdez Jesus D | $150,000 | |
| Closed | Valdez Jesus D | $153,375 |
Source: Public Records
Tax History
| Year | Tax Paid | Tax Assessment Tax Assessment Total Assessment is a certain percentage of the fair market value that is determined by local assessors to be the total taxable value of land and additions on the property. | Land | Improvement |
|---|---|---|---|---|
| 2025 | $2,989 | $250,803 | $100,317 | $150,486 |
| 2024 | $2,989 | $245,886 | $98,350 | $147,536 |
| 2023 | $2,879 | $241,065 | $96,421 | $144,644 |
| 2022 | $2,792 | $236,339 | $94,531 | $141,808 |
| 2021 | $2,768 | $231,705 | $92,677 | $139,028 |
| 2020 | $2,818 | $229,331 | $91,728 | $137,603 |
| 2019 | $2,737 | $224,835 | $89,930 | $134,905 |
| 2018 | $2,698 | $220,427 | $88,167 | $132,260 |
| 2017 | $2,560 | $216,106 | $86,439 | $129,667 |
| 2016 | $2,553 | $211,870 | $84,745 | $127,125 |
| 2015 | $2,579 | $208,689 | $83,473 | $125,216 |
| 2014 | $2,551 | $204,603 | $81,839 | $122,764 |
Source: Public Records
Map
Nearby Homes
- 1928 San Benito St
- 3700 Olds Rd Unit 86
- 1407 Peach Ave Unit 14
- 2178 Thrush Ave Unit J
- 2117 Cardinal Ave Unit 2117h
- 4032 Mockingbird Ln
- 2177 Robin Ave Unit 2177A
- 1645 Lime Ave Unit 91
- 2400 E Pleasant Valley Rd Unit 108
- 4200 Browning Dr
- 4108 Ranchita Ln
- 3130 Paula St
- 860 Morro Way
- 3151 Fournier St
- 4340 Highland Ave
- 2151 E Wooley Rd
- 360 Ibsen Place Unit 129
- 3631 La Costa Place
- 4160 Petit Dr Unit 39
- 320 Columbia Place Unit 46
- 2720 Trinity Place
- 2731 Tulare Place
- 2721 Tulare Place
- 2710 Trinity Place
- 2731 Trinity Place
- 2711 Tulare Place
- 2141 E Channel Islands Blvd
- 2721 Trinity Place
- 2700 Trinity Place
- 2711 Trinity Place
- 2701 Tulare Place
- 2701 Trinity Place
- 2630 Trinity Place
- 2730 Tulare Place
- 2720 Tulare Place
- 2631 Tulare Place
- 2730 Geronimo Dr
- 2710 Tulare Place
- 2720 Geronimo Dr
- 2734 Geronimo Dr
Your Personal Tour Guide
Ask me questions while you tour the home.