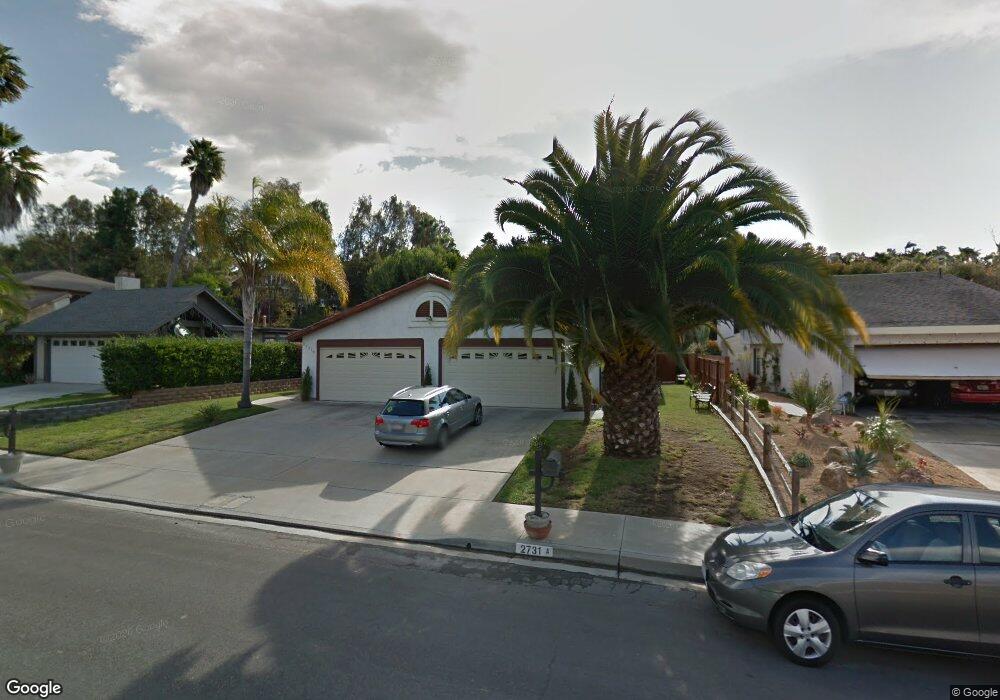
2731 Abejorro St Unit A Carlsbad, CA 92009
La Costa NeighborhoodEstimated Value: $1,838,000 - $2,149,614
6
Beds
4
Baths
3,544
Sq Ft
$552/Sq Ft
Est. Value
About This Home
This home is located at 2731 Abejorro St Unit A, Carlsbad, CA 92009 and is currently estimated at $1,957,904, approximately $552 per square foot. 2731 Abejorro St Unit A is a home located in San Diego County with nearby schools including La Costa Meadows Elementary, San Elijo Middle School, and San Marcos High School.
Ownership History
Date
Name
Owned For
Owner Type
Purchase Details
Closed on
Jul 1, 2015
Sold by
Cutuk Aida
Bought by
Close Cheryl
Current Estimated Value
Purchase Details
Closed on
Mar 25, 2004
Sold by
Cutuk Harry
Bought by
Cutuk Aida
Home Financials for this Owner
Home Financials are based on the most recent Mortgage that was taken out on this home.
Original Mortgage
$580,000
Interest Rate
3.5%
Mortgage Type
Unknown
Purchase Details
Closed on
Jul 7, 2000
Sold by
Harry Cutuk
Bought by
Cutuk Harry and Cutuk Aida
Home Financials for this Owner
Home Financials are based on the most recent Mortgage that was taken out on this home.
Original Mortgage
$256,250
Interest Rate
8.37%
Mortgage Type
Stand Alone First
Purchase Details
Closed on
Oct 19, 1983
Create a Home Valuation Report for This Property
The Home Valuation Report is an in-depth analysis detailing your home's value as well as a comparison with similar homes in the area
Home Values in the Area
Average Home Value in this Area
Purchase History
| Date | Buyer | Sale Price | Title Company |
|---|---|---|---|
| Close Cheryl | $1,059,500 | Equity Title San Diego | |
| Cutuk Aida | -- | Chicago Title Co | |
| Cutuk Harry | -- | American Title Ins Co | |
| -- | $67,000 | -- |
Source: Public Records
Mortgage History
| Date | Status | Borrower | Loan Amount |
|---|---|---|---|
| Previous Owner | Cutuk Aida | $580,000 | |
| Previous Owner | Cutuk Harry | $256,250 |
Source: Public Records
Tax History Compared to Growth
Tax History
| Year | Tax Paid | Tax Assessment Tax Assessment Total Assessment is a certain percentage of the fair market value that is determined by local assessors to be the total taxable value of land and additions on the property. | Land | Improvement |
|---|---|---|---|---|
| 2025 | $14,316 | $1,253,848 | $828,655 | $425,193 |
| 2024 | $14,316 | $1,229,263 | $812,407 | $416,856 |
| 2023 | $13,942 | $1,205,161 | $796,478 | $408,683 |
| 2022 | $13,640 | $1,181,531 | $780,861 | $400,670 |
| 2021 | $13,343 | $1,158,364 | $765,550 | $392,814 |
| 2020 | $13,178 | $1,146,488 | $757,701 | $388,787 |
| 2019 | $13,122 | $1,124,009 | $742,845 | $381,164 |
| 2018 | $12,812 | $1,101,971 | $728,280 | $373,691 |
| 2017 | $91 | $1,080,364 | $714,000 | $366,364 |
| 2016 | $12,375 | $1,059,181 | $700,000 | $359,181 |
| 2015 | $6,475 | $532,345 | $319,408 | $212,937 |
| 2014 | -- | $521,918 | $313,152 | $208,766 |
Source: Public Records
Map
Nearby Homes
- 6712 Cantil St
- 2515 Luciernaga St
- 7133 Obelisco Cir
- 7146 Argonauta Way
- 2568 Abedul St
- 6541 Vispera Place
- 6817 Vianda Ct
- 6844 Urubu St
- 2610 Acuna Ct
- 7215 El Fuerte St
- 6977 Corte Langosta
- 6502 La Paloma St
- 2647 Marmol Ct
- 3519 Via Nido
- 7319 Bolero St
- 6911 Goldstone Rd
- 6839 Helenite Place
- 7394 Altiva Place
- 3109 Camino Del Arco
- 3148 Vista Grande
- 2733 Abejorro St
- 2735 Abejorro St
- 2729 Abejorro St
- 2727 Abejorro St
- 2712 Cazadero Dr
- 2737 Abejorro St
- 2739 Abejorro St Unit 1A
- 2721-23 Abejorro St
- 2721 Abejorro St
- 2721 Abejorro St
- 6734 Antilope St
- 6730 Antilope St Unit U1
- 6741 Cantil St
- 2704 Cazadero Dr
- 6739 Cantil St Unit 41
- 2720 Cazadero Dr
- 2717 Abejorro St
- 2715 Abejorro St
- 2743 Abejorro St Unit 1
- 2741 Abejorro St