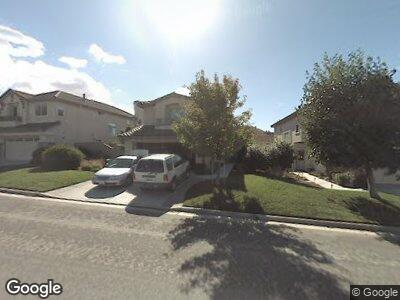
27323 Bavella Way Unit IX Salinas, CA 93908
River Road NeighborhoodEstimated Value: $859,000 - $969,000
3
Beds
3
Baths
1,570
Sq Ft
$578/Sq Ft
Est. Value
About This Home
This home is located at 27323 Bavella Way Unit IX, Salinas, CA 93908 and is currently estimated at $906,757, approximately $577 per square foot. 27323 Bavella Way Unit IX is a home located in Monterey County with nearby schools including Spreckels Elementary School, Buena Vista Middle School, and Salinas High School.
Ownership History
Date
Name
Owned For
Owner Type
Purchase Details
Closed on
Nov 17, 2003
Sold by
Dalhamer Christopher W and Dalhamer Dionne C
Bought by
Gonzales Paul G and Gonzales Ida Marie
Current Estimated Value
Home Financials for this Owner
Home Financials are based on the most recent Mortgage that was taken out on this home.
Original Mortgage
$444,000
Interest Rate
5.89%
Mortgage Type
Unknown
Purchase Details
Closed on
Sep 20, 2000
Sold by
L P R Associates Lp
Bought by
Dalhamer Christopher W and Dalhamer Dionne C
Home Financials for this Owner
Home Financials are based on the most recent Mortgage that was taken out on this home.
Original Mortgage
$302,900
Interest Rate
8.07%
Create a Home Valuation Report for This Property
The Home Valuation Report is an in-depth analysis detailing your home's value as well as a comparison with similar homes in the area
Home Values in the Area
Average Home Value in this Area
Purchase History
| Date | Buyer | Sale Price | Title Company |
|---|---|---|---|
| Gonzales Paul G | $553,000 | Old Republic Title | |
| Dalhamer Christopher W | $379,000 | Chicago Title Co |
Source: Public Records
Mortgage History
| Date | Status | Borrower | Loan Amount |
|---|---|---|---|
| Open | Gonzales Paul G | $612,000 | |
| Closed | Gonzales Paul G | $20,000 | |
| Closed | Gonzales Paul G | $540,000 | |
| Closed | Gonzales Paul G | $444,000 | |
| Previous Owner | Dalhamer Christopher W | $152,500 | |
| Previous Owner | Dalhamer Christopher W | $336,000 | |
| Previous Owner | Dalhamer Christopher W | $302,900 | |
| Closed | Dalhamer Christopher W | $37,800 | |
| Closed | Gonzales Paul G | $55,500 |
Source: Public Records
Tax History Compared to Growth
Tax History
| Year | Tax Paid | Tax Assessment Tax Assessment Total Assessment is a certain percentage of the fair market value that is determined by local assessors to be the total taxable value of land and additions on the property. | Land | Improvement |
|---|---|---|---|---|
| 2024 | $8,704 | $770,848 | $487,880 | $282,968 |
| 2023 | $8,400 | $755,734 | $478,314 | $277,420 |
| 2022 | $8,433 | $740,917 | $468,936 | $271,981 |
| 2021 | $7,496 | $675,000 | $427,000 | $248,000 |
| 2020 | $7,255 | $662,000 | $419,000 | $243,000 |
| 2019 | $7,192 | $647,000 | $409,000 | $238,000 |
| 2018 | $7,003 | $626,000 | $396,000 | $230,000 |
| 2017 | $6,933 | $594,000 | $376,000 | $218,000 |
| 2016 | $6,231 | $543,000 | $344,000 | $199,000 |
| 2015 | $5,888 | $503,000 | $318,000 | $185,000 |
| 2014 | $5,285 | $466,000 | $295,000 | $171,000 |
Source: Public Records
Map
Nearby Homes
- 27151 Prestancia Way
- 19302 Acclaim Dr
- 19379 Acclaim Dr
- 21428 Riverview Ct
- 25211 Azalea Ct
- 17588 River Run Rd
- 17666 Winding Creek Rd
- 17577 River Run Rd
- 18106 Stonehaven
- 17671 Riverbend Rd
- 18177 Stonegate Ct
- 20260 Portola Dr
- 22557 Black Mountain Rd
- 22524 Oak Canyon Rd
- 18725 Vasquez Ct
- 33 Fourth St
- 18030 Prado Ln
- 19625 Redding Dr
- 23465 Redding Cir
- 23507 Belmont Cir
- 27323 Bavella Way Unit IX
- 27351 Bavella Way
- 27347 Bavella Way
- 27319 Bavella Way
- 27327 Bavella Way
- 27315 Bavella Way
- 27331 Bavella Way
- 27311 Bavella Way
- 27324 Bavella Way
- 27335 Bavella Way
- 27320 Bavella Way Unit IX
- 27328 Bavella Way
- 27316 Bavella Way
- 27332 Bavella Way Unit IX
- 27312 Bavella Way
- 27307 Bavella Way
- 27339 Bavella Way
- 27336 Bavella Way
- 27308 Bavella Way
- 27340 Bavella Way