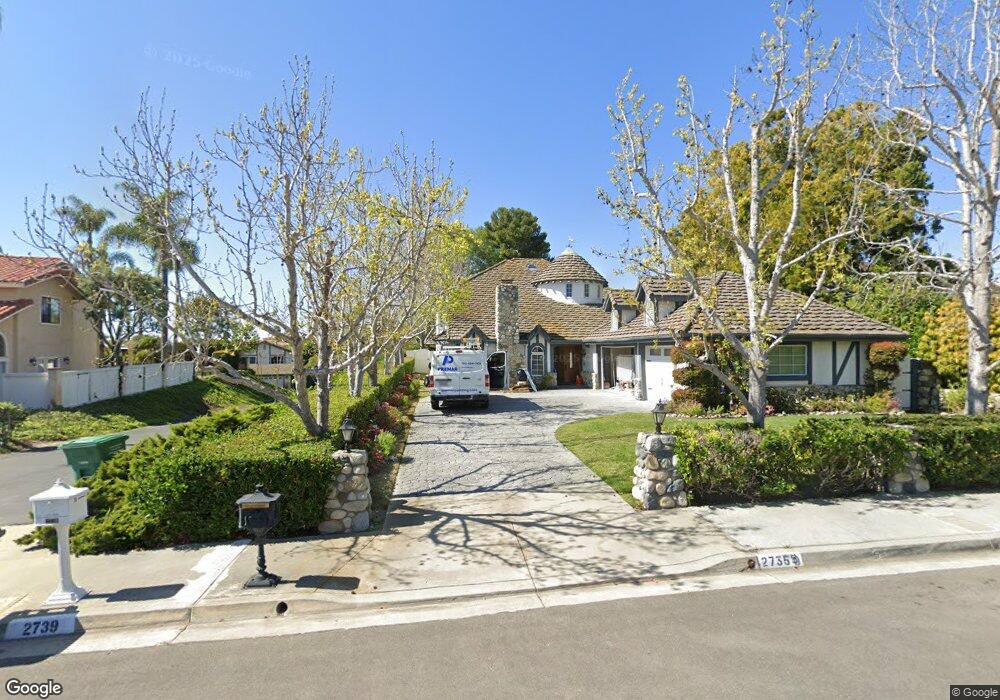
2735 Llama Ct Carlsbad, CA 92009
La Costa NeighborhoodEstimated Value: $2,005,323 - $2,890,000
3
Beds
3
Baths
3,382
Sq Ft
$743/Sq Ft
Est. Value
About This Home
This home is located at 2735 Llama Ct, Carlsbad, CA 92009 and is currently estimated at $2,514,081, approximately $743 per square foot. 2735 Llama Ct is a home located in San Diego County with nearby schools including La Costa Meadows Elementary, San Elijo Middle School, and San Marcos High School.
Ownership History
Date
Name
Owned For
Owner Type
Purchase Details
Closed on
Jul 12, 2011
Sold by
Rutan David A and Rutan Lisa A
Bought by
Rutan David A and Rutan Lisa A
Current Estimated Value
Purchase Details
Closed on
Mar 23, 1999
Sold by
Ca M Tr Montgomery Maria V Tr & Westermeyer
Bought by
Rutan David and Rutan Lisa
Home Financials for this Owner
Home Financials are based on the most recent Mortgage that was taken out on this home.
Original Mortgage
$456,000
Interest Rate
6.92%
Purchase Details
Closed on
Nov 12, 1993
Sold by
Montgomery Marcia N
Bought by
Montgomery Marcia N and Montgomery Maria
Purchase Details
Closed on
Oct 23, 1993
Sold by
Montgomery Maria V and Westermeyer Monica M
Bought by
Montgomery Marcia N
Purchase Details
Closed on
Mar 21, 1991
Create a Home Valuation Report for This Property
The Home Valuation Report is an in-depth analysis detailing your home's value as well as a comparison with similar homes in the area
Home Values in the Area
Average Home Value in this Area
Purchase History
| Date | Buyer | Sale Price | Title Company |
|---|---|---|---|
| Rutan David A | -- | None Available | |
| Rutan David A | -- | None Available | |
| Rutan David | $570,000 | Old Republic Title Co | |
| Montgomery Marcia N | -- | -- | |
| Montgomery Marcia N | -- | Southland Title Corporation | |
| -- | $560,000 | -- |
Source: Public Records
Mortgage History
| Date | Status | Borrower | Loan Amount |
|---|---|---|---|
| Previous Owner | Rutan David | $456,000 | |
| Closed | Rutan David | $57,000 |
Source: Public Records
Tax History Compared to Growth
Tax History
| Year | Tax Paid | Tax Assessment Tax Assessment Total Assessment is a certain percentage of the fair market value that is determined by local assessors to be the total taxable value of land and additions on the property. | Land | Improvement |
|---|---|---|---|---|
| 2025 | $9,938 | $893,580 | $313,534 | $580,046 |
| 2024 | $9,938 | $876,060 | $307,387 | $568,673 |
| 2023 | $9,696 | $858,883 | $301,360 | $557,523 |
| 2022 | $9,498 | $842,043 | $295,451 | $546,592 |
| 2021 | $9,302 | $825,533 | $289,658 | $535,875 |
| 2020 | $9,199 | $817,069 | $286,688 | $530,381 |
| 2019 | $9,158 | $801,049 | $281,067 | $519,982 |
| 2018 | $8,937 | $785,343 | $275,556 | $509,787 |
| 2017 | $8,770 | $769,945 | $270,153 | $499,792 |
| 2016 | $8,625 | $754,849 | $264,856 | $489,993 |
| 2015 | $8,473 | $743,511 | $260,878 | $482,633 |
| 2014 | $8,256 | $728,947 | $255,768 | $473,179 |
Source: Public Records
Map
Nearby Homes
- 2700 Argonauta St
- 6844 Urubu St
- 7173 Obelisco Cir
- 7133 Obelisco Cir
- 3229 Sitio Montecillo
- 6720 Antilope St
- 7146 Argonauta Way
- 6977 Corte Langosta
- 2515 Luciernaga St
- 2610 Acuna Ct
- 2789 Vista Del Oro Unit 13L
- 6817 Vianda Ct
- 3519 Via Nido
- 2568 Abedul St
- 2806 Cacatua St Unit A
- 6541 Vispera Place
- 7319 Bolero St
- 2647 Marmol Ct
- 3116 Vista Bonita
- 3109 Camino Del Arco