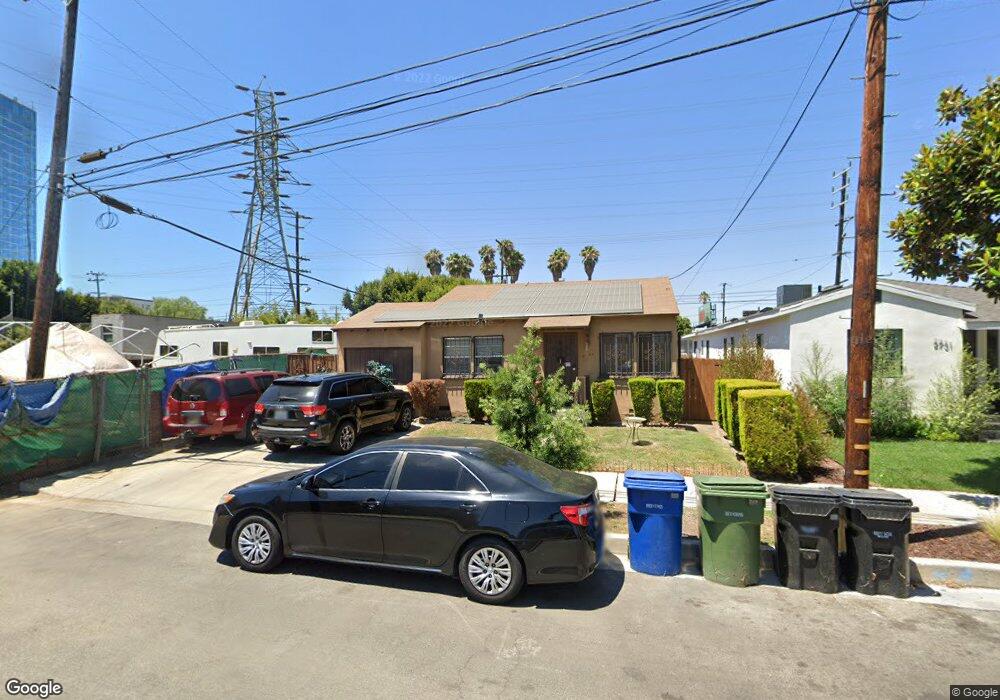
2735 S Genesee Ave Los Angeles, CA 90016
West Adams NeighborhoodEstimated Value: $845,000 - $1,083,000
2
Beds
1
Bath
790
Sq Ft
$1,215/Sq Ft
Est. Value
About This Home
This home is located at 2735 S Genesee Ave, Los Angeles, CA 90016 and is currently estimated at $959,564, approximately $1,214 per square foot. 2735 S Genesee Ave is a home located in Los Angeles County with nearby schools including Marvin Avenue Elementary School, Daniel Webster Middle School, and Alexander Hamilton Senior High School.
Ownership History
Date
Name
Owned For
Owner Type
Purchase Details
Closed on
Mar 18, 2022
Sold by
Hubbard Larry M
Bought by
Hubbard Family Trust
Current Estimated Value
Purchase Details
Closed on
Mar 24, 2020
Sold by
Hubbard Holla M
Bought by
Hubbard Holla M and Hubbard Larry M
Purchase Details
Closed on
Jun 24, 2004
Sold by
Hubbard Ricky B
Bought by
Hubbard Holla M
Purchase Details
Closed on
Jan 12, 2004
Sold by
Hubbard Holla M
Bought by
Hubbard Ricky B
Purchase Details
Closed on
Feb 11, 1999
Sold by
Hubbard Holla M
Bought by
Hubbard Holla M and Hubbard Ricky B
Purchase Details
Closed on
May 11, 1998
Sold by
Hubbard Derrick S
Bought by
Hubbard Holla M
Purchase Details
Closed on
Oct 22, 1996
Sold by
Daniels Leslie Charles and Daniels Lillian E
Bought by
Hubbard Holla M
Purchase Details
Closed on
Jul 19, 1995
Sold by
Hubbard Derrick S
Bought by
Daniels Leslie C and Daniels Lillian
Create a Home Valuation Report for This Property
The Home Valuation Report is an in-depth analysis detailing your home's value as well as a comparison with similar homes in the area
Home Values in the Area
Average Home Value in this Area
Purchase History
| Date | Buyer | Sale Price | Title Company |
|---|---|---|---|
| Hubbard Family Trust | -- | None Listed On Document | |
| Hubbard Holla M | -- | None Available | |
| Hubbard Holla M | -- | -- | |
| Hubbard Ricky B | -- | -- | |
| Hubbard Holla M | -- | -- | |
| Hubbard Holla M | -- | -- | |
| Hubbard Holla M | -- | -- | |
| Daniels Leslie C | -- | -- |
Source: Public Records
Tax History Compared to Growth
Tax History
| Year | Tax Paid | Tax Assessment Tax Assessment Total Assessment is a certain percentage of the fair market value that is determined by local assessors to be the total taxable value of land and additions on the property. | Land | Improvement |
|---|---|---|---|---|
| 2025 | $9,782 | $813,944 | $707,824 | $106,120 |
| 2024 | $9,782 | $797,986 | $693,946 | $104,040 |
| 2023 | $9,596 | $782,340 | $680,340 | $102,000 |
| 2022 | $1,947 | $148,845 | $102,816 | $46,029 |
| 2021 | $1,918 | $145,927 | $100,800 | $45,127 |
| 2020 | $1,935 | $144,432 | $99,767 | $44,665 |
| 2019 | $1,865 | $141,601 | $97,811 | $43,790 |
| 2018 | $1,828 | $138,826 | $95,894 | $42,932 |
| 2016 | $1,746 | $133,437 | $92,171 | $41,266 |
| 2015 | $1,723 | $131,434 | $90,787 | $40,647 |
| 2014 | $1,739 | $128,860 | $89,009 | $39,851 |
Source: Public Records
Map
Nearby Homes
- 2927 S Genesee Ave
- 2715 Clyde Ave
- 5630 Blackwelder St
- 5637 Smiley Dr
- 5820 David Ave
- 5830 David Ave
- 5832 David Ave
- 5832 David Ave Unit 1
- 5832 David Ave Unit 3
- 5832 David Ave Unit 1/2
- 3050 Reid Ave
- 5847 1/2 Ernest Ave
- 5524 Spokane St
- 5614 W Adams Blvd
- 6018 Comey Ave
- 5530 Geer St
- 5505 Homeside Ave
- 5511 Smiley Dr
- 5729 Clemson St
- 5462 Homeside Ave
- 2731 S Genesee Ave
- 2727 S Genesee Ave
- 2800 S Genesee Ave
- 2723 S Genesee Ave
- 2734 S Genesee Ave
- 2719 S Genesee Ave
- 2730 S Genesee Ave
- 2726 S Genesee Ave
- 2722 S Genesee Ave
- 2715 S Genesee Ave
- 2718 S Genesee Ave
- 2711 S Genesee Ave
- 2714 S Genesee Ave
- 2737 S Spaulding Ave
- 2733 S Spaulding Ave
- 2729 S Spaulding Ave
- 2707 S Genesee Ave
- 2710 S Genesee Ave
- 2725 S Spaulding Ave
- 2721 S Spaulding Ave