2736 Pomeroy Ave Los Angeles, CA 90033
Boyle Heights Neighborhood
1
Bed
1
Bath
700
Sq Ft
--
Built
About This Home
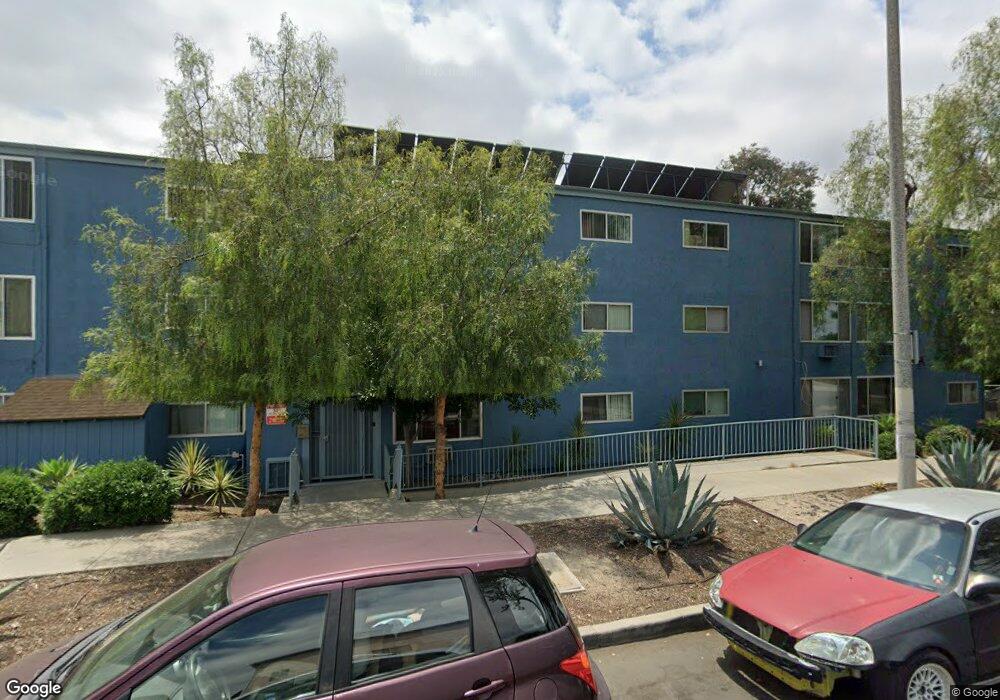
Welcome to Azure Heights!
While taking your daily afternoon stroll, you're sure to be stopped in your tracks when you come upon this blue beauty! With exterior paint color to die for, just wait til you see what's inside...
This building consists of 56 units, with multiple laundry rooms, an elevator, a picnic area out back, as well as a playground! Just the right place to call home.
Explore Ramona Gardens Natural Park nearby or treat yourself to dinner at X'tiosu Kitchen for some yummy Oaxacan/Mediterranean fusion food (featured on Netflix's "Ugly Delicious") just a few blocks away! Contact Kat to check out this place for yourself!
Create a Home Valuation Report for This Property
The Home Valuation Report is an in-depth analysis detailing your home's value as well as a comparison with similar homes in the area
Home Values in the Area
Average Home Value in this Area
Property History
| Date | Event | Price | List to Sale | Price per Sq Ft |
|---|---|---|---|---|
| 12/04/2024 12/04/24 | Off Market | $1,795 | -- | -- |
| 08/17/2024 08/17/24 | Price Changed | $1,795 | -5.3% | $3 / Sq Ft |
| 08/13/2024 08/13/24 | Price Changed | $1,895 | 0.0% | $3 / Sq Ft |
| 08/13/2024 08/13/24 | For Rent | $1,895 | +11.8% | -- |
| 05/10/2024 05/10/24 | Price Changed | $1,695 | -5.6% | $2 / Sq Ft |
| 04/26/2024 04/26/24 | Price Changed | $1,795 | -14.3% | $3 / Sq Ft |
| 04/23/2024 04/23/24 | Price Changed | $2,095 | +16.7% | $3 / Sq Ft |
| 08/08/2023 08/08/23 | For Rent | $1,795 | 0.0% | -- |
| 06/26/2023 06/26/23 | Price Changed | $1,795 | 0.0% | $3 / Sq Ft |
| 06/24/2023 06/24/23 | Price Changed | $1,795 | 0.0% | $3 / Sq Ft |
| 06/24/2023 06/24/23 | For Rent | $1,795 | -- | -- |
Tax History
| Year | Tax Paid | Tax Assessment Tax Assessment Total Assessment is a certain percentage of the fair market value that is determined by local assessors to be the total taxable value of land and additions on the property. | Land | Improvement |
|---|---|---|---|---|
| 2025 | $94,001 | $7,685,702 | $1,596,721 | $6,088,981 |
| 2024 | $94,001 | $7,535,003 | $1,565,413 | $5,969,590 |
| 2023 | $92,206 | $7,387,259 | $1,534,719 | $5,852,540 |
| 2022 | $88,012 | $7,242,412 | $1,504,627 | $5,737,785 |
| 2021 | $86,769 | $7,100,405 | $1,475,125 | $5,625,280 |
| 2019 | $3,711 | $2,847,620 | $171,043 | $2,676,577 |
| 2018 | $4,459 | $2,807,688 | $167,690 | $2,639,998 |
| 2016 | $35,075 | $2,683,285 | $161,179 | $2,522,106 |
| 2015 | $3,712 | $2,642,980 | $158,758 | $2,484,222 |
| 2014 | $4,661 | $2,591,209 | $155,649 | $2,435,560 |
Source: Public Records
Map
Nearby Homes
- 3232 Marengo St
- 2627 Pomeroy Ave
- 2683 Marengo St
- 2711 Wabash Ave
- 1023 Sentinel Ave
- 2800 Wabash Ave
- 2814 Wabash Ave
- 1301 Stone St
- 2500 Ganahl St
- 2482 Pomeroy Ave
- 2740 Fairmount St
- 2647 Chelsea St Unit 4
- 3202 Ganahl St
- 2553 Verde St
- 3127 Wabash Ave
- 919 Stone St
- 2440 Wabash Ave
- 2737 Winter St
- 2500 Fairmount St
- 1236 Dickson Ave
- 2736 Pomeroy Ave Unit 201
- 2736 Pomeroy Ave Unit 56
- 2736 Pomeroy Ave Unit 55
- 2736 Pomeroy Ave
- 2736 Pomeroy Ave Unit 108
- 2736 Pomeroy Ave Unit 102
- 2736 Pomeroy Ave Unit 105
- 2736 Pomeroy Ave Unit 316
- 2726 Pomeroy Ave
- 2750 Pomeroy Ave
- 2754 Pomeroy Ave
- 2718 Pomeroy Ave
- 2737 Pomeroy Ave
- 2751 Ganahl St
- 2741 Ganahl St
- 2749 Pomeroy Ave
- 2747 Pomeroy Ave
- 2760 Pomeroy Ave
- 2731 Ganahl St
- 2716 Pomeroy Ave
Your Personal Tour Guide
Ask me questions while you tour the home.