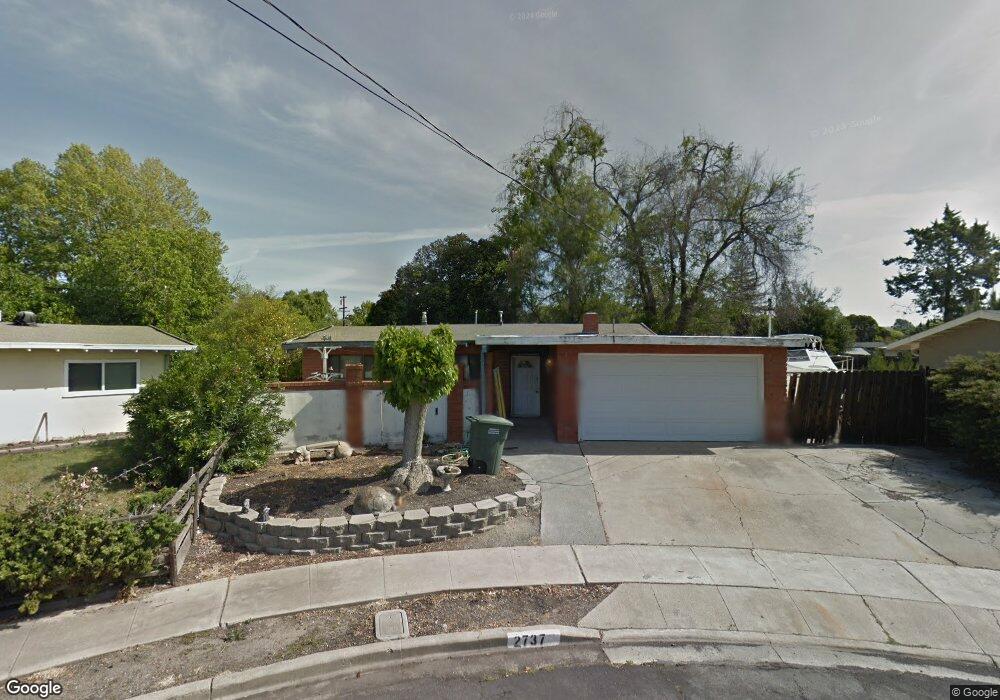
2737 Westgate Ct Concord, CA 94520
Buchanan Field NeighborhoodEstimated Value: $614,000 - $708,000
3
Beds
1
Bath
1,020
Sq Ft
$632/Sq Ft
Est. Value
About This Home
This home is located at 2737 Westgate Ct, Concord, CA 94520 and is currently estimated at $644,224, approximately $631 per square foot. 2737 Westgate Ct is a home located in Contra Costa County with nearby schools including Holbrook Language Academy, Valley View Middle School, and Mt. Diablo High School.
Ownership History
Date
Name
Owned For
Owner Type
Purchase Details
Closed on
Dec 13, 2018
Sold by
Atkinson Nelson
Bought by
Vuong Stephen H
Current Estimated Value
Home Financials for this Owner
Home Financials are based on the most recent Mortgage that was taken out on this home.
Original Mortgage
$453,100
Outstanding Balance
$399,987
Interest Rate
4.9%
Mortgage Type
New Conventional
Estimated Equity
$244,237
Purchase Details
Closed on
Nov 28, 2017
Sold by
Travers Fred S
Bought by
Atkinson Nelson
Purchase Details
Closed on
Mar 15, 2007
Sold by
Vandergroen Mary E
Bought by
Travers Fred S
Purchase Details
Closed on
Apr 18, 2005
Sold by
Vandergroen Mary E
Bought by
Vandergroen Mary E and Travers Fred S
Purchase Details
Closed on
Apr 26, 1999
Sold by
Vandergroen George P and Vandergroen Mary E
Bought by
Vandergroen George P and Vandergroen Mary E
Create a Home Valuation Report for This Property
The Home Valuation Report is an in-depth analysis detailing your home's value as well as a comparison with similar homes in the area
Home Values in the Area
Average Home Value in this Area
Purchase History
| Date | Buyer | Sale Price | Title Company |
|---|---|---|---|
| Vuong Stephen H | $485,000 | Old Republic Title Company | |
| Atkinson Nelson | $350,000 | Old Republic Title Company | |
| Atkinson Nelson | -- | Old Republic Title Company | |
| Travers Fred S | -- | Liberty Title Company | |
| Vandergroen Mary E | $94,000 | Chicago Title | |
| Vandergroen George P | -- | -- |
Source: Public Records
Mortgage History
| Date | Status | Borrower | Loan Amount |
|---|---|---|---|
| Open | Vuong Stephen H | $453,100 |
Source: Public Records
Tax History
| Year | Tax Paid | Tax Assessment Tax Assessment Total Assessment is a certain percentage of the fair market value that is determined by local assessors to be the total taxable value of land and additions on the property. | Land | Improvement |
|---|---|---|---|---|
| 2025 | $6,984 | $541,020 | $379,272 | $161,748 |
| 2024 | $6,671 | $530,413 | $371,836 | $158,577 |
| 2023 | $6,671 | $520,014 | $364,546 | $155,468 |
| 2022 | $6,578 | $509,819 | $357,399 | $152,420 |
| 2021 | $6,414 | $499,824 | $350,392 | $149,432 |
| 2019 | $6,290 | $485,000 | $340,000 | $145,000 |
| 2018 | $4,654 | $350,000 | $300,000 | $50,000 |
| 2017 | $4,573 | $350,500 | $273,469 | $77,031 |
| 2016 | $4,143 | $317,000 | $247,331 | $69,669 |
| 2015 | $3,805 | $287,500 | $224,314 | $63,186 |
| 2014 | $3,191 | $234,500 | $182,962 | $51,538 |
Source: Public Records
Map
Nearby Homes
- 2831 Richard Ave
- 2819 Kay Ave
- 2719 Edward Ave
- 2102 Overhill Rd
- 2766 Argyll Ave
- 2780 Argyll Ave
- 2868 Avon Ave
- 1838 Overhill Rd
- 2917 Knoll Dr
- 2829 Hilltop Rd
- 2219 Acacia Dr
- 2719 Grant St
- 2067 Olivera Rd Unit B
- 2069 Olivera Rd Unit E
- 2097 Dalis Dr Unit 79
- 2197 Dalis Dr Unit 124
- 2653 Garden Ave
- 3185 Claudia Dr
- 2227 Dalis Dr Unit 159
- 3242 Ida Dr
- 2731 Westgate Ct
- 2743 Westgate Ct
- 2930 Lion Ct
- 2936 Lion Ct
- 2918 Richard Ave
- 2924 Richard Ave
- 2725 Westgate Ct
- 2755 Westgate Ave
- 2749 Westgate Ave
- 2912 Richard Ave
- 2719 Westgate Ct
- 2713 Westgate Ct
- 2942 Lion Ct
- 2761 Westgate Ave
- 2906 Richard Ave
- 2707 Westgate Ave
- 2872 Richard Ave
- 2801 Westgate Ave
- 2948 Richard Ave
- 2860 Richard Ave
Your Personal Tour Guide
Ask me questions while you tour the home.