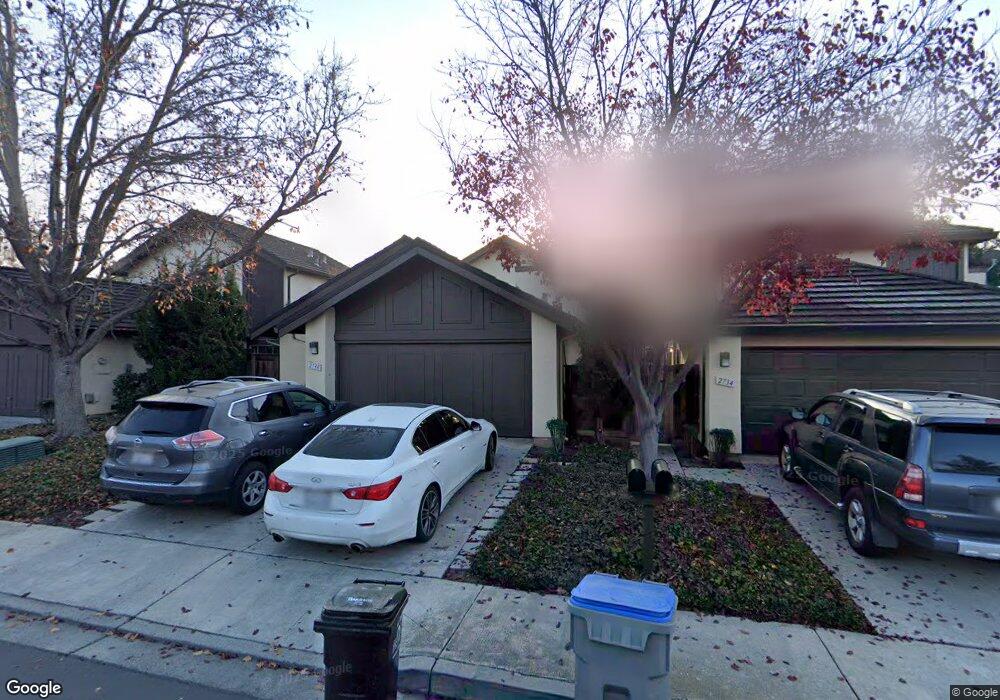
2738 Mabury Square San Jose, CA 95133
Penitencia NeighborhoodEstimated Value: $1,295,837 - $1,651,000
3
Beds
3
Baths
1,746
Sq Ft
$871/Sq Ft
Est. Value
About This Home
This home is located at 2738 Mabury Square, San Jose, CA 95133 and is currently estimated at $1,519,959, approximately $870 per square foot. 2738 Mabury Square is a home located in Santa Clara County with nearby schools including Summerdale Elementary School, Piedmont Middle School, and Independence High School.
Ownership History
Date
Name
Owned For
Owner Type
Purchase Details
Closed on
Jul 29, 2014
Sold by
Fung Paul C
Bought by
Fung Paul C
Current Estimated Value
Purchase Details
Closed on
Mar 7, 2012
Sold by
Fung Paul C
Bought by
Fung Paul C
Home Financials for this Owner
Home Financials are based on the most recent Mortgage that was taken out on this home.
Original Mortgage
$184,037
Interest Rate
3.84%
Mortgage Type
New Conventional
Purchase Details
Closed on
Jul 23, 2003
Sold by
Fung Paul C and Fung Anita K
Bought by
Fung Paul C and Fung Anita K
Create a Home Valuation Report for This Property
The Home Valuation Report is an in-depth analysis detailing your home's value as well as a comparison with similar homes in the area
Home Values in the Area
Average Home Value in this Area
Purchase History
| Date | Buyer | Sale Price | Title Company |
|---|---|---|---|
| Fung Paul C | -- | None Available | |
| Fung Paul C | -- | First American Title | |
| Fung Paul C | -- | -- | |
| Fung Paul C | -- | -- |
Source: Public Records
Mortgage History
| Date | Status | Borrower | Loan Amount |
|---|---|---|---|
| Closed | Fung Paul C | $184,037 |
Source: Public Records
Tax History Compared to Growth
Tax History
| Year | Tax Paid | Tax Assessment Tax Assessment Total Assessment is a certain percentage of the fair market value that is determined by local assessors to be the total taxable value of land and additions on the property. | Land | Improvement |
|---|---|---|---|---|
| 2025 | $4,295 | $219,233 | $59,928 | $159,305 |
| 2024 | $4,295 | $214,935 | $58,753 | $156,182 |
| 2023 | $4,295 | $210,721 | $57,601 | $153,120 |
| 2022 | $4,157 | $206,590 | $56,472 | $150,118 |
| 2021 | $3,991 | $202,540 | $55,365 | $147,175 |
| 2020 | $3,840 | $200,464 | $54,798 | $145,666 |
| 2019 | $3,689 | $196,534 | $53,724 | $142,810 |
| 2018 | $3,624 | $192,681 | $52,671 | $140,010 |
| 2017 | $3,621 | $188,904 | $51,639 | $137,265 |
| 2016 | $3,467 | $185,201 | $50,627 | $134,574 |
| 2015 | $3,419 | $182,420 | $49,867 | $132,553 |
| 2014 | $2,920 | $178,848 | $48,891 | $129,957 |
Source: Public Records
Map
Nearby Homes
- 2598 Mabury Square
- 2714 Mabury Square
- 2806 Glauser Dr
- 825 N Capitol Ave Unit 4
- 714 N Capitol Ave
- 981 Harcot Ct
- 994 Harcot Ct
- 997 Harcot Ct
- 982 Harcot Ct
- 674 Galleon Ct
- 998 Harcot Ct
- 931 ToMcOt Ct
- 990 Harcot Ct
- 970 E Harcot Ct
- Residence 2 Plan at Ascend
- Residence 1 Plan at Ascend
- Residence 3 Plan at Ascend
- 709 Whitewater Ct Unit 44
- 2623 Gimelli Place Unit 139
- 1055 N Capitol Ave Unit 124
- 2742 Mabury Square
- 2730 Mabury Square
- 2746 Mabury Square
- 795 Clearview Dr
- 2726 Mabury Square
- 781 Clearview Dr
- 807 Clearview Dr
- 2750 Mabury Square
- 2722 Mabury Square
- 775 Clearview Dr
- 811 Clearview Dr
- 2754 Mabury Square
- 2718 Mabury Square
- 769 Clearview Dr
- 2733 Mabury Square
- 815 Clearview Dr
- 2737 Mabury Square
- 2758 Mabury Square
- 2729 Mabury Square
- 2725 Mabury Square