
Seller's Agent in 2025
Lisa DeLoose
KW 1Advantage
(309) 314-2499
3 in this area
97 Total Sales
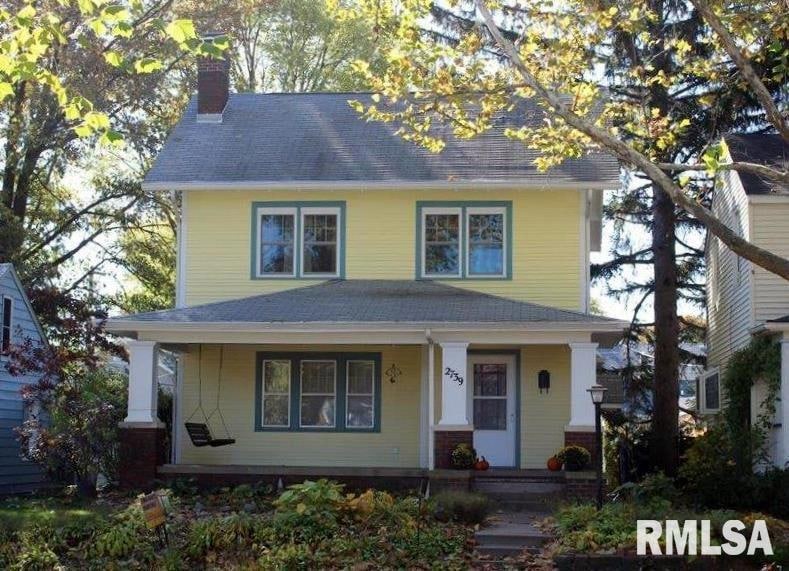
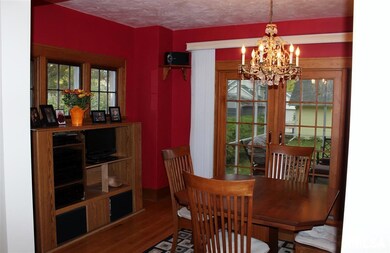
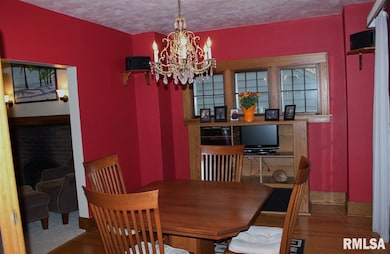
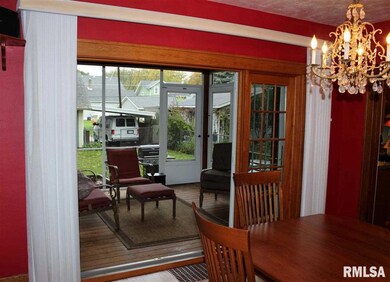
Gorgeous 2 story home in East Davenport, just north of the McClellan Heights. This home features 3 bedrooms (den could be used as a 4th bedroom), 3 baths. Beautifully updated kitchen (2009), some newer windows, stunning hardwood floors, newer mechanicals. Beautiful original woodwork on the main level. All of the appliances will remain with this home! Freshly painted exterior, living room, and entry way. Enjoy relaxing in the screened in porch located off of the dining room. The basement has been drain tiled and waterproofed with 2 sump pumps. Call today for your private showing!
Last Agent to Sell the Property
RE/MAX Concepts Bettendorf License #S60801000/475.201713 Listed on: 10/15/2014
| Date | Type | Sale Price | Title Company |
|---|---|---|---|
| Warranty Deed | $230,000 | None Listed On Document | |
| Warranty Deed | $130,000 | None Available |
| Date | Status | Loan Amount | Loan Type |
|---|---|---|---|
| Open | $223,100 | New Conventional | |
| Previous Owner | $75,050 | New Conventional | |
| Previous Owner | $54,650 | New Conventional |
| Date | Event | Price | Change | Sq Ft Price |
|---|---|---|---|---|
| 07/07/2025 07/07/25 | Sold | $230,000 | +15.6% | $111 / Sq Ft |
| 06/07/2025 06/07/25 | Pending | -- | -- | -- |
| 06/04/2025 06/04/25 | For Sale | $199,000 | +53.1% | $96 / Sq Ft |
| 12/19/2014 12/19/14 | Sold | $130,000 | -13.3% | $79 / Sq Ft |
| 11/26/2014 11/26/14 | Pending | -- | -- | -- |
| 10/15/2014 10/15/14 | For Sale | $149,900 | -- | $91 / Sq Ft |
| Year | Tax Paid | Tax Assessment Tax Assessment Total Assessment is a certain percentage of the fair market value that is determined by local assessors to be the total taxable value of land and additions on the property. | Land | Improvement |
|---|---|---|---|---|
| 2024 | $2,560 | $157,300 | $24,000 | $133,300 |
| 2023 | $3,298 | $157,300 | $24,000 | $133,300 |
| 2022 | $3,168 | $163,320 | $22,000 | $141,320 |
| 2021 | $3,168 | $156,590 | $22,000 | $134,590 |
| 2020 | $2,598 | $145,370 | $22,000 | $123,370 |
| 2019 | $2,624 | $125,450 | $22,000 | $103,450 |
| 2018 | $2,756 | $125,450 | $22,000 | $103,450 |
| 2017 | $698 | $125,450 | $22,000 | $103,450 |
| 2016 | $2,584 | $117,990 | $0 | $0 |
| 2015 | $2,584 | $119,440 | $0 | $0 |
| 2014 | $2,460 | $119,440 | $0 | $0 |
| 2013 | $2,412 | $0 | $0 | $0 |
| 2012 | -- | $111,770 | $21,240 | $90,530 |
Seller's Agent in 2025
Lisa DeLoose
KW 1Advantage
(309) 314-2499
3 in this area
97 Total Sales
Buyer's Agent in 2025
Shelly Coussens
[Mel Foster Brand]
(563) 381-7748
3 in this area
149 Total Sales
Seller's Agent in 2014
Sandra Kaas
RE/MAX
(563) 570-0251
1 in this area
55 Total Sales
F
Buyer's Agent in 2014
Fred Haussmann
KW 1Advantage
(563) 343-4747
8 in this area
41 Total Sales
Source: RMLS Alliance
MLS Number: RMAQC4155919
APN: D0055-06
Disclaimer: Certain information contained herein is derived from information provided by parties other than Homes.com. All information provided is deemed reliable, but is not guaranteed to be accurate and should be independently verified.
![]() IDX information is provided exclusively for personal, non-commercial use, and may not be used for any purpose other than to identify prospective properties consumers may be interested in purchasing. Information is deemed reliable but not guaranteed.
IDX information is provided exclusively for personal, non-commercial use, and may not be used for any purpose other than to identify prospective properties consumers may be interested in purchasing. Information is deemed reliable but not guaranteed.