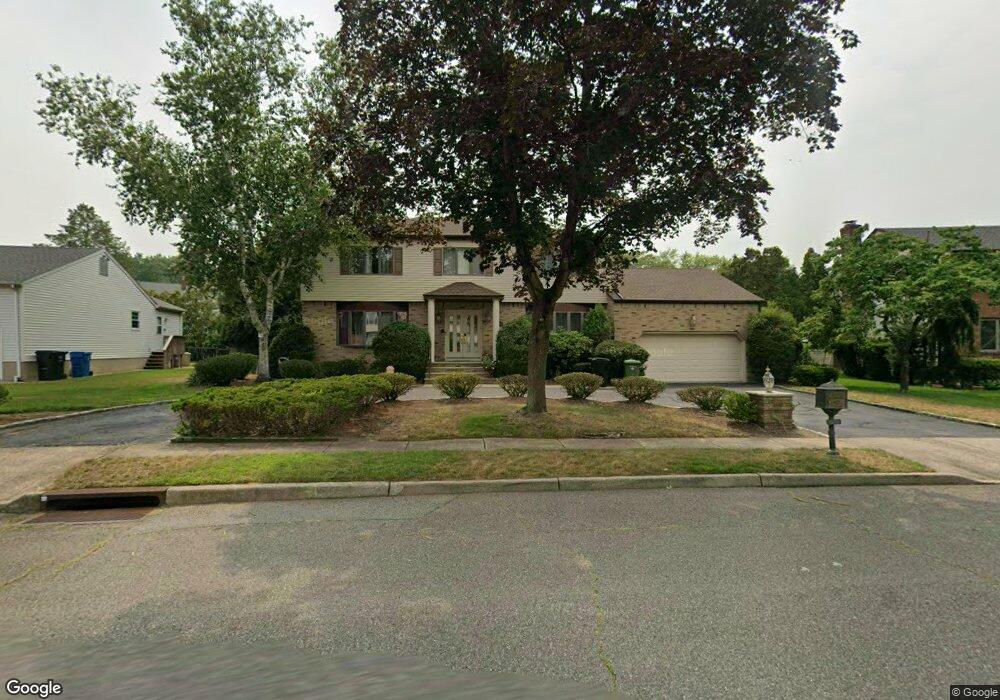
274 Purdue Ct Paramus, NJ 07652
Estimated Value: $1,188,965 - $1,344,000
Studio
--
Bath
2,700
Sq Ft
$471/Sq Ft
Est. Value
About This Home
This home is located at 274 Purdue Ct, Paramus, NJ 07652 and is currently estimated at $1,272,491, approximately $471 per square foot. 274 Purdue Ct is a home located in Bergen County with nearby schools including Paramus High School, Alpine Learning Group, and Paramus Catholic High School.
Ownership History
Date
Name
Owned For
Owner Type
Purchase Details
Closed on
Jan 17, 2014
Sold by
Wicker William C and Wicker Linda M
Bought by
John Joby and John Nithi
Current Estimated Value
Home Financials for this Owner
Home Financials are based on the most recent Mortgage that was taken out on this home.
Original Mortgage
$616,000
Outstanding Balance
$448,674
Interest Rate
3.5%
Mortgage Type
New Conventional
Estimated Equity
$823,817
Purchase Details
Closed on
Jan 10, 2012
Sold by
Fox Robert and Fox Adeline
Bought by
Wicker William C and Wicker Linda M
Home Financials for this Owner
Home Financials are based on the most recent Mortgage that was taken out on this home.
Original Mortgage
$515,000
Interest Rate
3.94%
Mortgage Type
Purchase Money Mortgage
Purchase Details
Closed on
Oct 2, 2000
Bought by
Fox Robert
Home Financials for this Owner
Home Financials are based on the most recent Mortgage that was taken out on this home.
Original Mortgage
$100,000
Interest Rate
7.94%
Create a Home Valuation Report for This Property
The Home Valuation Report is an in-depth analysis detailing your home's value as well as a comparison with similar homes in the area
Home Values in the Area
Average Home Value in this Area
Purchase History
| Date | Buyer | Sale Price | Title Company |
|---|---|---|---|
| John Joby | $775,000 | -- | |
| Wicker William C | $725,000 | -- | |
| Fox Robert | -- | -- | |
| Fox Robert | -- | -- |
Source: Public Records
Mortgage History
| Date | Status | Borrower | Loan Amount |
|---|---|---|---|
| Open | John Joby | $616,000 | |
| Previous Owner | Wicker William C | $515,000 | |
| Previous Owner | Fox Robert | $100,000 |
Source: Public Records
Tax History
| Year | Tax Paid | Tax Assessment Tax Assessment Total Assessment is a certain percentage of the fair market value that is determined by local assessors to be the total taxable value of land and additions on the property. | Land | Improvement |
|---|---|---|---|---|
| 2025 | $12,754 | $926,200 | $446,300 | $479,900 |
| 2024 | $12,398 | $842,400 | $385,600 | $456,800 |
| 2023 | $11,766 | $808,200 | $367,700 | $440,500 |
| 2022 | $11,766 | $758,100 | $343,400 | $414,700 |
| 2021 | $11,482 | $694,200 | $312,600 | $381,600 |
| 2020 | $11,068 | $693,900 | $317,600 | $376,300 |
| 2019 | $11,546 | $622,100 | $331,100 | $291,000 |
| 2018 | $11,403 | $622,100 | $331,100 | $291,000 |
| 2017 | $11,204 | $622,100 | $331,100 | $291,000 |
| 2016 | $10,899 | $622,100 | $331,100 | $291,000 |
| 2015 | $10,787 | $622,100 | $331,100 | $291,000 |
| 2014 | $10,694 | $622,100 | $331,100 | $291,000 |
Source: Public Records
Map
Nearby Homes
- 495 Paramus Rd
- 232 W Midland Ave
- 218 Mayfair Rd
- 602 Mill Run
- 605 Craig Ave
- 496 Cedar Ln
- 648 Falmouth Ave
- 86 Azalea St
- 516 Stevens Ave
- 596 Grove St
- 133 Morristown Place
- 11 Gabriel Ct
- 14 Gabriel Ct
- 24 Gabriel Ct
- 16 Gabriel Ct
- 47 Herold Dr
- 522 Grove St
- 33 Beekman Place
- 643 Spring Ave
- 338 S van Dien Ave
Your Personal Tour Guide
Ask me questions while you tour the home.