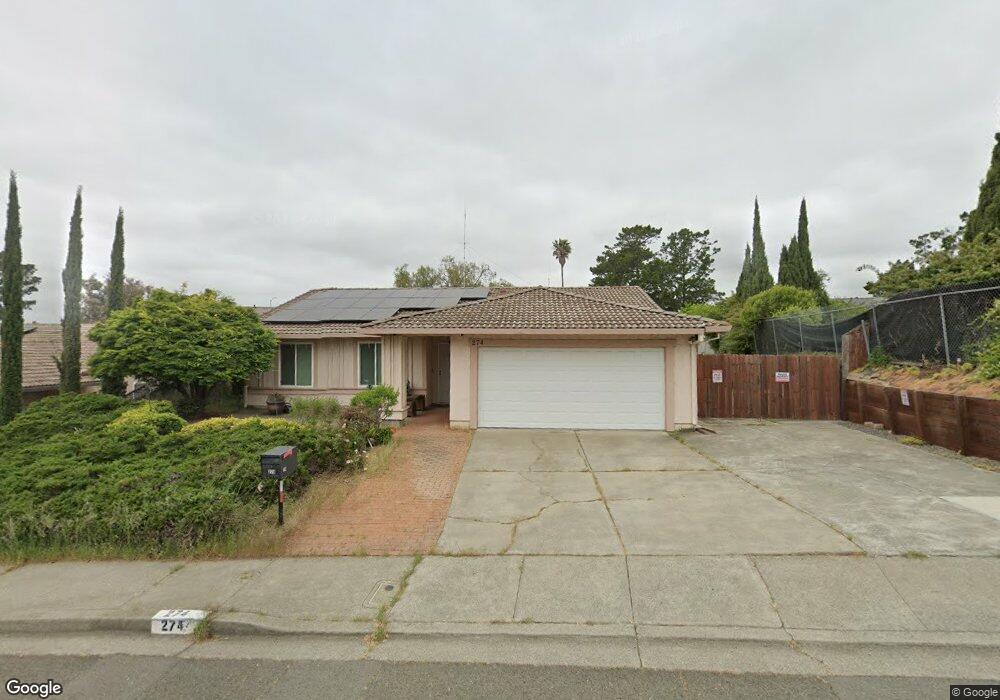
274 Temple Way Vallejo, CA 94591
Estimated Value: $590,660 - $670,000
3
Beds
2
Baths
1,868
Sq Ft
$335/Sq Ft
Est. Value
About This Home
This home is located at 274 Temple Way, Vallejo, CA 94591 and is currently estimated at $625,915, approximately $335 per square foot. 274 Temple Way is a home located in Solano County with nearby schools including Joseph H. Wardlaw Elementary School, Hogan Middle School, and Jesse M. Bethel High School.
Ownership History
Date
Name
Owned For
Owner Type
Purchase Details
Closed on
Aug 10, 2017
Sold by
Brenden Rita Ann
Bought by
Brenden Rita Ann and Rita A Brenden Living Trust
Current Estimated Value
Purchase Details
Closed on
Jul 29, 2009
Sold by
Federal Home Loan Mortgage Corporation
Bought by
Brenden Rita Ann
Purchase Details
Closed on
Jun 19, 2009
Sold by
Perseveranda Paolo
Bought by
Federal Home Loan Mortgage Corporation
Purchase Details
Closed on
Apr 17, 2007
Sold by
Glebatis Kathleen A
Bought by
Perseveranda Paolo
Home Financials for this Owner
Home Financials are based on the most recent Mortgage that was taken out on this home.
Original Mortgage
$100,000
Interest Rate
6.14%
Mortgage Type
Stand Alone Second
Purchase Details
Closed on
Sep 26, 1994
Sold by
Campanian Robert D and Glebatis Kathleen A
Bought by
Glebatis Kathleen A
Create a Home Valuation Report for This Property
The Home Valuation Report is an in-depth analysis detailing your home's value as well as a comparison with similar homes in the area
Home Values in the Area
Average Home Value in this Area
Purchase History
| Date | Buyer | Sale Price | Title Company |
|---|---|---|---|
| Brenden Rita Ann | -- | None Available | |
| Brenden Rita Ann | $206,500 | Chicago Title Ins Co | |
| Federal Home Loan Mortgage Corporation | $210,328 | Accommodation | |
| Perseveranda Paolo | $500,000 | Alliance Title Company | |
| Glebatis Kathleen A | $21,000 | -- |
Source: Public Records
Mortgage History
| Date | Status | Borrower | Loan Amount |
|---|---|---|---|
| Previous Owner | Perseveranda Paolo | $100,000 | |
| Previous Owner | Perseveranda Paolo | $400,000 |
Source: Public Records
Tax History Compared to Growth
Tax History
| Year | Tax Paid | Tax Assessment Tax Assessment Total Assessment is a certain percentage of the fair market value that is determined by local assessors to be the total taxable value of land and additions on the property. | Land | Improvement |
|---|---|---|---|---|
| 2025 | $4,003 | $266,027 | $122,622 | $143,405 |
| 2024 | $4,003 | $260,812 | $120,218 | $140,594 |
| 2023 | $3,759 | $255,699 | $117,861 | $137,838 |
| 2022 | $3,660 | $250,686 | $115,550 | $135,136 |
| 2021 | $3,577 | $245,772 | $113,285 | $132,487 |
| 2020 | $3,587 | $243,253 | $112,124 | $131,129 |
| 2019 | $3,472 | $238,484 | $109,926 | $128,558 |
| 2018 | $3,246 | $233,809 | $107,771 | $126,038 |
| 2017 | $3,095 | $229,225 | $105,658 | $123,567 |
| 2016 | $2,524 | $224,732 | $103,587 | $121,145 |
| 2015 | $2,490 | $221,358 | $102,032 | $119,326 |
| 2014 | $2,454 | $217,023 | $100,034 | $116,989 |
Source: Public Records
Map
Nearby Homes
- 138 Parkhaven Dr
- 108 Hilltop Dr
- 136 Evergreen Way
- 351 Springbrook Dr
- 272 Woodridge Dr
- 134 Nashville Ln
- 559 Topley Ct
- 367 Darley Dr
- 1025 Columbus Pkwy
- 1218 Locust Dr
- 2500 Springs Rd Unit 121
- 2500 Springs Rd Unit 226
- 2500 Springs Rd Unit 116
- 2500 Springs Rd Unit 126
- 1213 Hale St
- 1407 Eucalyptus Dr
- 1290 Rachel Way
- 670 Henry St
- 2409 Springs Rd
- 121 Kim Ct
- 268 Temple Way
- 105 Gregory Ln
- 111 Gregory Ln
- 138 Terrybrook Ct
- 144 Terrybrook Ct
- 117 Gregory Ln
- 262 Temple Way
- 123 Gregory Ln
- 131 Terrybrook Ct
- 256 Temple Way
- 132 Terrybrook Ct
- 300 Temple Way
- 110 Gregory Ln
- 129 Gregory Ln
- 116 Gregory Ln
- 125 Terrybrook Ct
- 108 Terrybrook Ln
- 250 Temple Way
- 126 Terrybrook Ct
- 306 Temple Way