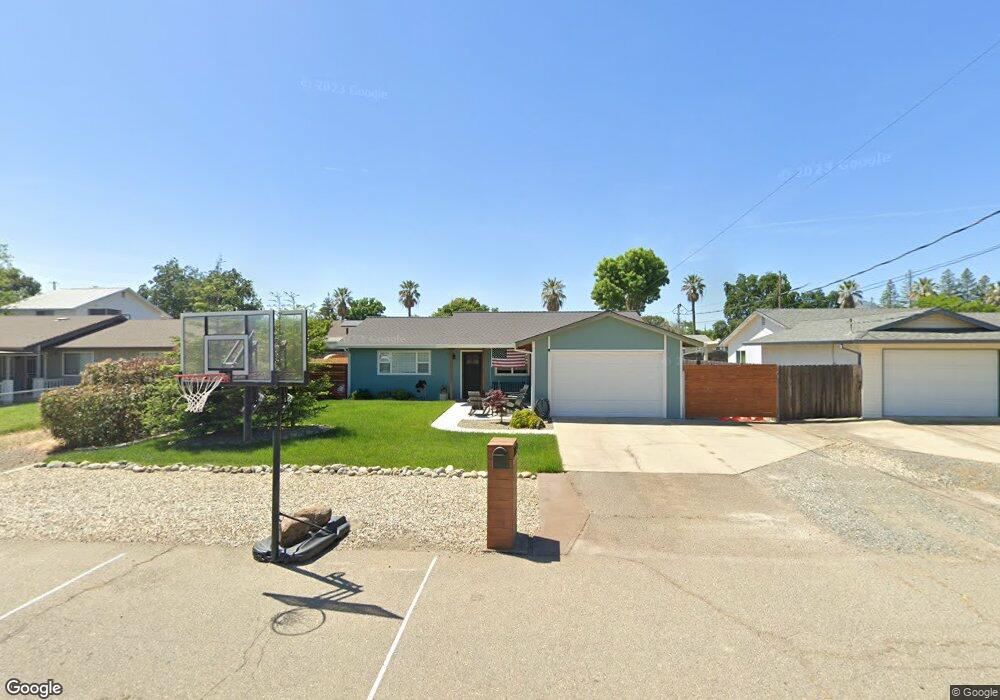
2740 Pepper St Sutter, CA 95982
Estimated Value: $337,000 - $358,181
3
Beds
1
Bath
1,104
Sq Ft
$312/Sq Ft
Est. Value
About This Home
This home is located at 2740 Pepper St, Sutter, CA 95982 and is currently estimated at $344,295, approximately $311 per square foot. 2740 Pepper St is a home located in Sutter County with nearby schools including Brittan Elementary School, Sutter High School, and Christian Outreach Fellowship.
Ownership History
Date
Name
Owned For
Owner Type
Purchase Details
Closed on
Aug 4, 2017
Sold by
Carter James
Bought by
Millington Christopher and Millington Emery
Current Estimated Value
Home Financials for this Owner
Home Financials are based on the most recent Mortgage that was taken out on this home.
Original Mortgage
$191,468
Outstanding Balance
$160,450
Interest Rate
4.12%
Mortgage Type
FHA
Estimated Equity
$183,845
Purchase Details
Closed on
Jun 9, 2010
Sold by
Dye Terry P and Dye Angela M
Bought by
Carter James
Home Financials for this Owner
Home Financials are based on the most recent Mortgage that was taken out on this home.
Original Mortgage
$129,259
Interest Rate
5.25%
Mortgage Type
FHA
Purchase Details
Closed on
May 17, 2010
Sold by
Lee Adrianne
Bought by
Carter James
Home Financials for this Owner
Home Financials are based on the most recent Mortgage that was taken out on this home.
Original Mortgage
$129,259
Interest Rate
5.25%
Mortgage Type
FHA
Create a Home Valuation Report for This Property
The Home Valuation Report is an in-depth analysis detailing your home's value as well as a comparison with similar homes in the area
Home Values in the Area
Average Home Value in this Area
Purchase History
| Date | Buyer | Sale Price | Title Company |
|---|---|---|---|
| Millington Christopher | $195,000 | First American Title Company | |
| Carter James | $131,000 | North State Title Company | |
| Carter James | -- | North State Title Company |
Source: Public Records
Mortgage History
| Date | Status | Borrower | Loan Amount |
|---|---|---|---|
| Open | Millington Christopher | $191,468 | |
| Previous Owner | Carter James | $129,259 |
Source: Public Records
Tax History
| Year | Tax Paid | Tax Assessment Tax Assessment Total Assessment is a certain percentage of the fair market value that is determined by local assessors to be the total taxable value of land and additions on the property. | Land | Improvement |
|---|---|---|---|---|
| 2025 | $2,288 | $221,871 | $51,200 | $170,671 |
| 2024 | $2,288 | $217,522 | $50,197 | $167,325 |
| 2023 | $2,288 | $213,258 | $49,213 | $164,045 |
| 2022 | $2,352 | $209,078 | $48,249 | $160,829 |
| 2021 | $2,330 | $204,980 | $47,303 | $157,677 |
| 2020 | $2,301 | $202,878 | $46,818 | $156,060 |
| 2019 | $2,479 | $198,900 | $45,900 | $153,000 |
| 2018 | $2,456 | $195,000 | $45,000 | $150,000 |
| 2017 | $1,862 | $145,701 | $38,928 | $106,773 |
| 2016 | $1,849 | $142,843 | $38,164 | $104,679 |
Source: Public Records
Map
Nearby Homes
- 2431 Madrone St
- 7669 Barrow St
- 2371 Elm St
- 2227 W Ridge Dr
- 2211 W Ridge Dr
- 2185 Perry St
- 1939 1st Ave
- 8617 S Butte Rd
- 8454 Pass Rd
- 1244 Acacia Ave
- 5576 S Butte Rd
- 8970 S Butte Rd
- 2065 Howlett Ave
- 4423 Dresser Rd
- 4361 Dresser Rd
- 1803 Lynchburg Dr
- 1270 Tulio St
- 3295 Jefferson Ave
- 3327 Sam Brannan Way
- 2127 Pepperwood Dr
Your Personal Tour Guide
Ask me questions while you tour the home.