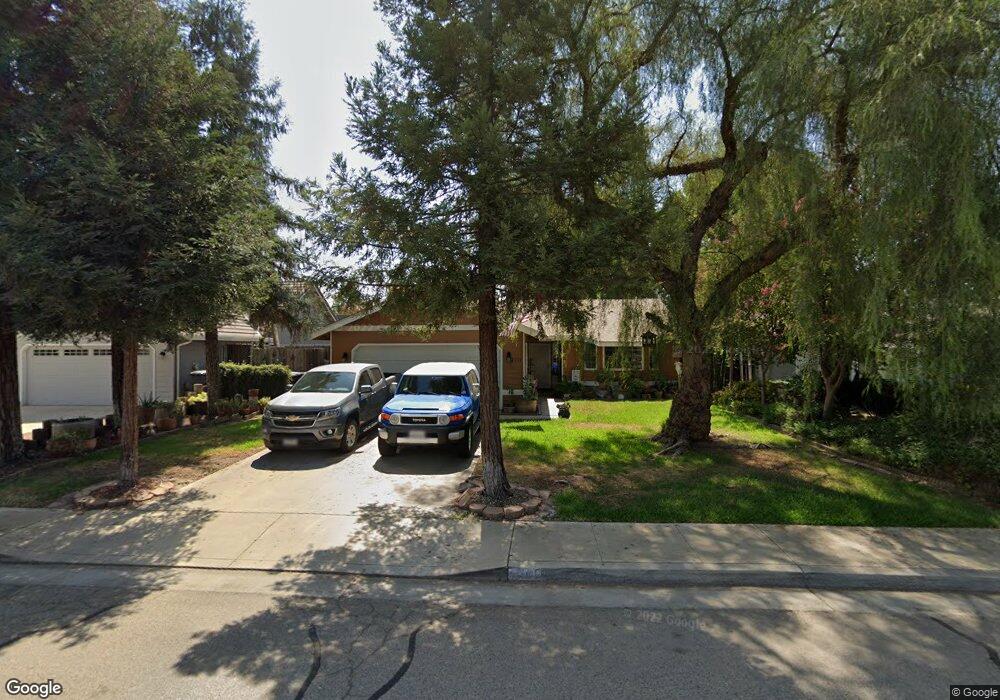
2741 E Delta Ave Visalia, CA 93292
Northeast Visalia NeighborhoodEstimated Value: $316,000 - $402,000
3
Beds
2
Baths
1,497
Sq Ft
$236/Sq Ft
Est. Value
About This Home
This home is located at 2741 E Delta Ave, Visalia, CA 93292 and is currently estimated at $353,902, approximately $236 per square foot. 2741 E Delta Ave is a home located in Tulare County with nearby schools including Golden Oak Elementary School, Valley Oak Middle School, and Golden West High School.
Ownership History
Date
Name
Owned For
Owner Type
Purchase Details
Closed on
Sep 6, 2000
Sold by
Verlato Richard C
Bought by
Deighton James and Deighton Vicky
Current Estimated Value
Home Financials for this Owner
Home Financials are based on the most recent Mortgage that was taken out on this home.
Original Mortgage
$112,098
Outstanding Balance
$40,508
Interest Rate
7.98%
Mortgage Type
VA
Estimated Equity
$313,394
Purchase Details
Closed on
Oct 17, 1995
Sold by
Verlato Danica M
Bought by
Verlato Richard C
Home Financials for this Owner
Home Financials are based on the most recent Mortgage that was taken out on this home.
Original Mortgage
$94,000
Interest Rate
7.59%
Purchase Details
Closed on
Nov 23, 1994
Sold by
Merrill Arthur Q
Bought by
Verlato Richard C
Home Financials for this Owner
Home Financials are based on the most recent Mortgage that was taken out on this home.
Original Mortgage
$94,500
Interest Rate
6.62%
Create a Home Valuation Report for This Property
The Home Valuation Report is an in-depth analysis detailing your home's value as well as a comparison with similar homes in the area
Home Values in the Area
Average Home Value in this Area
Purchase History
| Date | Buyer | Sale Price | Title Company |
|---|---|---|---|
| Deighton James | $110,000 | Chicago Title Co | |
| Verlato Richard C | -- | -- | |
| Verlato Richard C | $105,500 | Chicago Title Company |
Source: Public Records
Mortgage History
| Date | Status | Borrower | Loan Amount |
|---|---|---|---|
| Open | Deighton James | $112,098 | |
| Previous Owner | Verlato Richard C | $94,000 | |
| Previous Owner | Verlato Richard C | $94,500 |
Source: Public Records
Tax History
| Year | Tax Paid | Tax Assessment Tax Assessment Total Assessment is a certain percentage of the fair market value that is determined by local assessors to be the total taxable value of land and additions on the property. | Land | Improvement |
|---|---|---|---|---|
| 2025 | $1,722 | $165,760 | $45,210 | $120,550 |
| 2024 | $1,722 | $162,511 | $44,324 | $118,187 |
| 2023 | $1,674 | $159,325 | $43,455 | $115,870 |
| 2022 | $1,600 | $156,202 | $42,603 | $113,599 |
| 2021 | $1,601 | $153,140 | $41,768 | $111,372 |
| 2020 | $1,584 | $151,570 | $41,340 | $110,230 |
| 2019 | $1,542 | $148,598 | $40,529 | $108,069 |
| 2018 | $1,499 | $145,684 | $39,734 | $105,950 |
| 2017 | $1,486 | $142,828 | $38,955 | $103,873 |
| 2016 | $1,454 | $140,027 | $38,191 | $101,836 |
| 2015 | $1,411 | $137,923 | $37,617 | $100,306 |
| 2014 | $1,411 | $135,221 | $36,880 | $98,341 |
Source: Public Records
Map
Nearby Homes
- 2615 E Norman Dr
- 2400 E Sweet Ave
- 2824 S Cain St
- 2635 S Cain Ct
- 1641 N Virmargo St
- 2228 E Four Creeks Ave
- 1537 N Irma St
- 3142 E Race Ave
- 2032 E Pershing Ave
- 209 N Kennedy St Unit Mw107
- 2745 E Goshen Ave
- 2703 E Goshen Ave
- 1915 E Houston Ave
- 2721 E Goshen Ave
- 524 N Velie Ct
- 825 N Manzanita St
- 2046 E Goshen Ave
- 1505 N Arden Ct
- 1909 E Andrea Ct
- 2121 E Goshen Ave
- 2731 E Delta Ave
- 2801 E Delta Ave
- 1409 N Alder Ct
- 2721 E Delta Ave
- 1412 N Maple St
- 2811 E Delta Ave
- 2744 E Delta Ave
- 2734 E Delta Ave
- 2804 E Delta Ave
- 2726 E Delta Ave
- 2812 E Delta Ave
- 2716 E Delta Ave
- 2647 E Delta Ave
- 2735 E Sweet Ave
- 2747 E Sweet Ave
- 2702 E Delta Ave
- 2729 E Sweet Ave Unit 1
- 2729 E Sweet Ave
- 2742 E Cecil Ave
- 1411 N Maple St
Your Personal Tour Guide
Ask me questions while you tour the home.