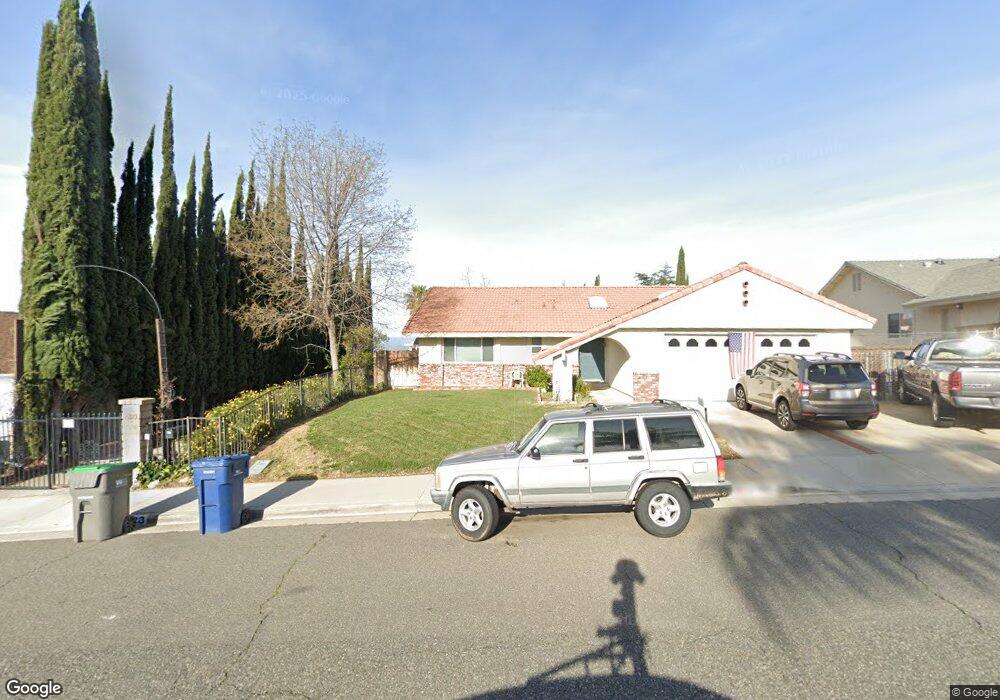
27423 Garza Dr Santa Clarita, CA 91350
Saugus NeighborhoodEstimated Value: $865,130 - $997,000
4
Beds
2
Baths
1,815
Sq Ft
$502/Sq Ft
Est. Value
About This Home
This home is located at 27423 Garza Dr, Santa Clarita, CA 91350 and is currently estimated at $911,283, approximately $502 per square foot. 27423 Garza Dr is a home located in Los Angeles County with nearby schools including Highlands Elementary School, Arroyo Seco Junior High School, and Saugus High School.
Ownership History
Date
Name
Owned For
Owner Type
Purchase Details
Closed on
Jul 20, 2018
Sold by
Campb
Bought by
Campb
Current Estimated Value
Home Financials for this Owner
Home Financials are based on the most recent Mortgage that was taken out on this home.
Interest Rate
4.52%
Purchase Details
Closed on
May 2, 2011
Sold by
Bank Of America N A
Bought by
Campbell Albert J and Campbell Tracy B
Home Financials for this Owner
Home Financials are based on the most recent Mortgage that was taken out on this home.
Original Mortgage
$434,893
Interest Rate
4.71%
Mortgage Type
VA
Purchase Details
Closed on
Jan 18, 2011
Sold by
Hann Theodore S and Hann Kristine J
Bought by
Bank Of America N A
Purchase Details
Closed on
Mar 27, 1996
Sold by
Harris Venicia
Bought by
Hann Theodore S and Hann Kristine J
Purchase Details
Closed on
Dec 10, 1993
Sold by
Harris John
Bought by
Harris Venecia
Create a Home Valuation Report for This Property
The Home Valuation Report is an in-depth analysis detailing your home's value as well as a comparison with similar homes in the area
Home Values in the Area
Average Home Value in this Area
Purchase History
| Date | Buyer | Sale Price | Title Company |
|---|---|---|---|
| Campb | -- | -- | |
| Campbell Albert J | $421,000 | Lawyers Title | |
| Bank Of America N A | $375,000 | Accommodation | |
| Hann Theodore S | $215,000 | Commonwealth Title | |
| Harris Venecia | -- | -- |
Source: Public Records
Mortgage History
| Date | Status | Borrower | Loan Amount |
|---|---|---|---|
| Closed | Campb | -- | |
| Previous Owner | Campbell Albert J | $434,893 |
Source: Public Records
Tax History Compared to Growth
Tax History
| Year | Tax Paid | Tax Assessment Tax Assessment Total Assessment is a certain percentage of the fair market value that is determined by local assessors to be the total taxable value of land and additions on the property. | Land | Improvement |
|---|---|---|---|---|
| 2025 | $7,309 | $539,365 | $283,007 | $256,358 |
| 2024 | $7,309 | $528,790 | $277,458 | $251,332 |
| 2023 | $7,165 | $518,422 | $272,018 | $246,404 |
| 2022 | $7,144 | $508,258 | $266,685 | $241,573 |
| 2021 | $7,020 | $498,293 | $261,456 | $236,837 |
| 2019 | $6,764 | $483,515 | $253,702 | $229,813 |
| 2018 | $6,582 | $474,035 | $248,728 | $225,307 |
| 2016 | $6,222 | $455,629 | $239,070 | $216,559 |
| 2015 | $5,990 | $448,786 | $235,479 | $213,307 |
| 2014 | $5,905 | $439,996 | $230,867 | $209,129 |
Source: Public Records
Map
Nearby Homes
- 22346 Cheraw Dr
- 22403 Los Rogues Dr
- 27127 Rio Bosque Dr
- 27619 Ron Ridge Dr
- 27021 Rio Bosque Dr
- 27362 Santa Clarita Rd
- 27231 Cabrera Ave
- 22903 Vista Delgado Dr
- 22725 Garzota Dr
- 22654 La Rochelle Dr
- 22660 La Rochelle Dr
- 22810 Rio Chico Dr
- 22003 Caceras St
- 27439 Santa Clarita Rd
- 27215 Elias Ave
- 21983 Centurion Way
- 22949 Sycamore Creek Dr
- 26953 Cuatro Milpas St
- 26927 Cuatro Milpas St
- 22123 Alamogordo Rd
- 27425 Garza Dr
- 27419 Garza Dr
- 22419 Alamota Dr
- 27429 Garza Dr
- 22411 Alamota Dr
- 22403 Alamota Dr
- 27433 Garza Dr
- 27437 Garza Dr
- 27426 Garza Dr
- 27420 Garza Dr
- 22418 Alamota Dr
- 22412 Alamota Dr
- 27441 Garza Dr
- 27430 Garza Dr
- 27416 Garza Dr
- 27411 Garza Dr
- 22422 Alamota Dr
- 27436 Garza Dr
- 22450 Tula Dr
- 27445 Garza Dr