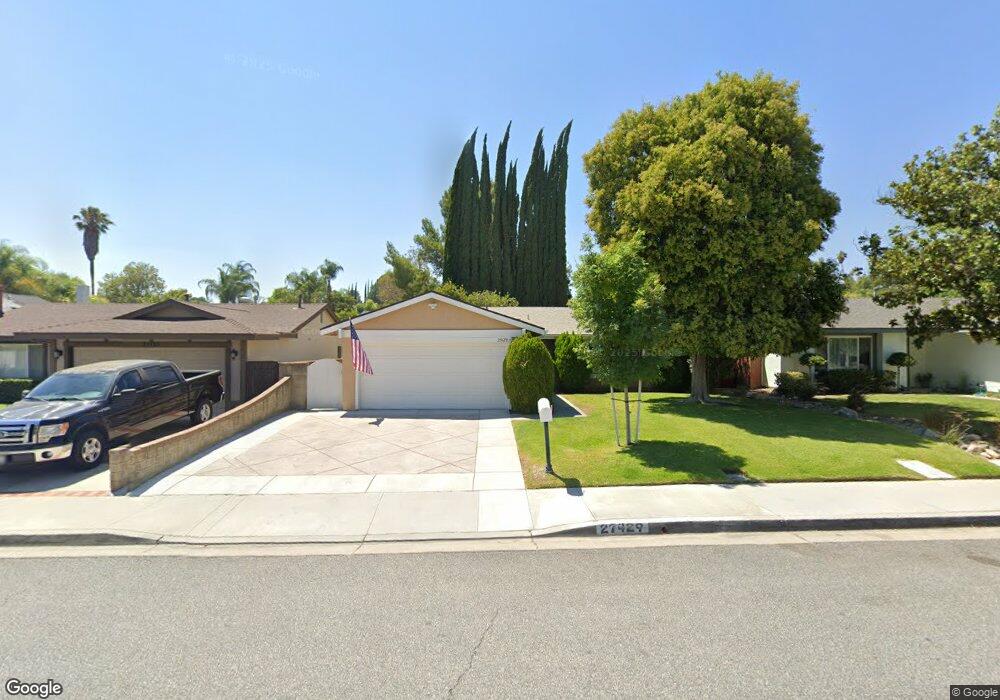
27429 Cherry Creek Dr Valencia, CA 91354
Estimated Value: $725,000 - $749,000
4
Beds
2
Baths
1,382
Sq Ft
$534/Sq Ft
Est. Value
About This Home
This home is located at 27429 Cherry Creek Dr, Valencia, CA 91354 and is currently estimated at $738,649, approximately $534 per square foot. 27429 Cherry Creek Dr is a home located in Los Angeles County with nearby schools including Santa Clarita Elementary School, Arroyo Seco Junior High School, and Saugus High School.
Ownership History
Date
Name
Owned For
Owner Type
Purchase Details
Closed on
Nov 11, 2010
Sold by
Grady Felicia
Bought by
Grady Felicia and Felicia Grady 2008 Trust
Current Estimated Value
Purchase Details
Closed on
Jul 27, 2010
Sold by
Grady Felicia and Felicia Grady 2008 Trust
Bought by
Grady Felicia
Purchase Details
Closed on
Jul 23, 2008
Sold by
Grady Felicia and Grady Felicia S
Bought by
Grady Felicia and Felicia Grady 2008 Trust
Purchase Details
Closed on
Dec 13, 2002
Sold by
Grady Victor A and Grady Felicia S
Bought by
Grady Felicia S
Purchase Details
Closed on
Sep 22, 1993
Sold by
Williams Barton J and Williams Nancy
Bought by
Grady Victor A
Home Financials for this Owner
Home Financials are based on the most recent Mortgage that was taken out on this home.
Original Mortgage
$132,000
Interest Rate
6.81%
Create a Home Valuation Report for This Property
The Home Valuation Report is an in-depth analysis detailing your home's value as well as a comparison with similar homes in the area
Home Values in the Area
Average Home Value in this Area
Purchase History
| Date | Buyer | Sale Price | Title Company |
|---|---|---|---|
| Grady Felicia | -- | Accommodation | |
| Grady Felicia | -- | Accommodation | |
| Grady Felicia | -- | Accommodation | |
| Grady Felicia | -- | None Available | |
| Grady Felicia S | $552,000 | First Southwestern | |
| Grady Victor A | $165,000 | Gateway Title |
Source: Public Records
Mortgage History
| Date | Status | Borrower | Loan Amount |
|---|---|---|---|
| Closed | Grady Victor A | $132,000 |
Source: Public Records
Tax History Compared to Growth
Tax History
| Year | Tax Paid | Tax Assessment Tax Assessment Total Assessment is a certain percentage of the fair market value that is determined by local assessors to be the total taxable value of land and additions on the property. | Land | Improvement |
|---|---|---|---|---|
| 2025 | $4,319 | $280,415 | $135,956 | $144,459 |
| 2024 | $4,110 | $274,918 | $133,291 | $141,627 |
| 2023 | $3,975 | $269,528 | $130,678 | $138,850 |
| 2022 | $3,985 | $264,244 | $128,116 | $136,128 |
| 2021 | $3,915 | $259,063 | $125,604 | $133,459 |
| 2020 | $3,877 | $256,408 | $124,317 | $132,091 |
| 2019 | $3,779 | $251,381 | $121,880 | $129,501 |
| 2018 | $3,661 | $246,453 | $119,491 | $126,962 |
| 2016 | $3,442 | $236,885 | $114,852 | $122,033 |
| 2015 | $3,312 | $233,327 | $113,127 | $120,200 |
| 2014 | $3,258 | $228,757 | $110,911 | $117,846 |
Source: Public Records
Map
Nearby Homes
- 27362 Santa Clarita Rd
- 27439 Santa Clarita Rd
- 22660 La Rochelle Dr
- 22949 Sycamore Creek Dr
- 22654 La Rochelle Dr
- 27573 Santa Clarita Rd
- 27717 Sequoia Glen Dr
- 22403 Los Rogues Dr
- 27371 Blueridge Dr
- 27127 Rio Bosque Dr
- 27240 Trenton Place
- 22903 Vista Delgado Dr
- 27302 Weathersfield Dr
- 22346 Cheraw Dr
- 27619 Ron Ridge Dr
- 27829 Carnegie Ave
- 27929 Dexter Dr
- 27021 Rio Bosque Dr
- 27872 Cherry Creek Dr
- 27829 Coldsprings Place
- 27425 Cherry Creek Dr
- 27435 Cherry Creek Dr
- 27419 Cherry Creek Dr
- 27439 Cherry Creek Dr
- 27445 Cherry Creek Dr
- 27411 Cherry Creek Dr
- 27430 Cherry Creek Dr
- 27426 Cherry Creek Dr
- 27414 Sycamore Creek Dr
- 27436 Cherry Creek Dr
- 27420 Cherry Creek Dr
- 27418 Sycamore Creek Dr
- 27408 Sycamore Creek Dr
- 27424 Sycamore Creek Dr
- 27402 Sycamore Creek Dr
- 27449 Cherry Creek Dr
- 27442 Cherry Creek Dr
- 27414 Cherry Creek Dr
- 27405 Cherry Creek Dr
- 27430 Sycamore Creek Dr