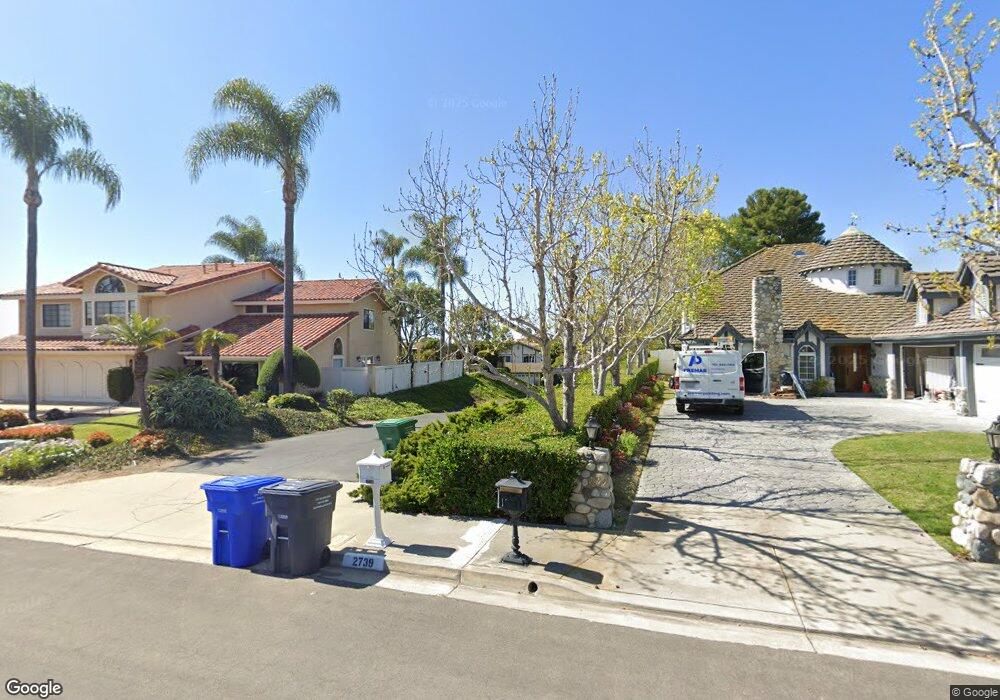
2743 Llama Ct Carlsbad, CA 92009
La Costa NeighborhoodEstimated Value: $1,893,000 - $2,208,000
4
Beds
3
Baths
2,674
Sq Ft
$759/Sq Ft
Est. Value
About This Home
This home is located at 2743 Llama Ct, Carlsbad, CA 92009 and is currently estimated at $2,028,293, approximately $758 per square foot. 2743 Llama Ct is a home located in San Diego County with nearby schools including La Costa Meadows Elementary, San Elijo Middle School, and San Marcos High School.
Ownership History
Date
Name
Owned For
Owner Type
Purchase Details
Closed on
Dec 31, 2003
Sold by
Traurig Bernard H and Traurig Christine
Bought by
Traurig Christine
Current Estimated Value
Home Financials for this Owner
Home Financials are based on the most recent Mortgage that was taken out on this home.
Original Mortgage
$364,000
Outstanding Balance
$169,992
Interest Rate
5.88%
Mortgage Type
Purchase Money Mortgage
Estimated Equity
$1,858,301
Purchase Details
Closed on
Apr 24, 2000
Sold by
Traurig Bernard H
Bought by
Traurig Christine
Purchase Details
Closed on
Mar 19, 1998
Sold by
Misiolek Leon Roger and Misiolek Lucia
Bought by
Traurig Benard H and Traurig Christina
Home Financials for this Owner
Home Financials are based on the most recent Mortgage that was taken out on this home.
Original Mortgage
$319,900
Interest Rate
7.06%
Purchase Details
Closed on
Jul 20, 1984
Create a Home Valuation Report for This Property
The Home Valuation Report is an in-depth analysis detailing your home's value as well as a comparison with similar homes in the area
Home Values in the Area
Average Home Value in this Area
Purchase History
| Date | Buyer | Sale Price | Title Company |
|---|---|---|---|
| Traurig Christine | -- | Chicago Title Co | |
| Traurig Christine | -- | -- | |
| Traurig Benard H | $400,000 | Fidelity National Title Co | |
| -- | $182,000 | -- |
Source: Public Records
Mortgage History
| Date | Status | Borrower | Loan Amount |
|---|---|---|---|
| Open | Traurig Christine | $364,000 | |
| Closed | Traurig Benard H | $319,900 |
Source: Public Records
Tax History Compared to Growth
Tax History
| Year | Tax Paid | Tax Assessment Tax Assessment Total Assessment is a certain percentage of the fair market value that is determined by local assessors to be the total taxable value of land and additions on the property. | Land | Improvement |
|---|---|---|---|---|
| 2025 | $7,258 | $638,523 | $207,564 | $430,959 |
| 2024 | $7,258 | $626,004 | $203,495 | $422,509 |
| 2023 | $7,067 | $613,730 | $199,505 | $414,225 |
| 2022 | $6,913 | $601,697 | $195,594 | $406,103 |
| 2021 | $6,763 | $589,900 | $191,759 | $398,141 |
| 2020 | $6,680 | $583,852 | $189,793 | $394,059 |
| 2019 | $6,650 | $572,405 | $186,072 | $386,333 |
| 2018 | $6,492 | $561,182 | $182,424 | $378,758 |
| 2017 | $91 | $550,180 | $178,848 | $371,332 |
| 2016 | $6,268 | $539,393 | $175,342 | $364,051 |
| 2015 | $6,151 | $531,292 | $172,709 | $358,583 |
| 2014 | $5,988 | $520,885 | $169,326 | $351,559 |
Source: Public Records
Map
Nearby Homes
- 7173 Obelisco Cir
- 7133 Obelisco Cir
- 2819 Cazadero Dr
- 7146 Argonauta Way
- 2816 Cebu Ct
- 6977 Corte Langosta
- Lot # 258 Luciiernaga St Unit 258
- 3519 Via Nido
- 6817 Vianda Ct
- 7319 Bolero St
- 0 Bolero St
- 2647 Marmol Ct
- 2915 Managua Place
- 3148 Vista Grande
- 3103 Camino Del Arco
- 7309 Calle Alma
- 6429 La Vanco Ct
- 7394 Altiva Place
- 2830 Esturion Place
- 6502 La Paloma St