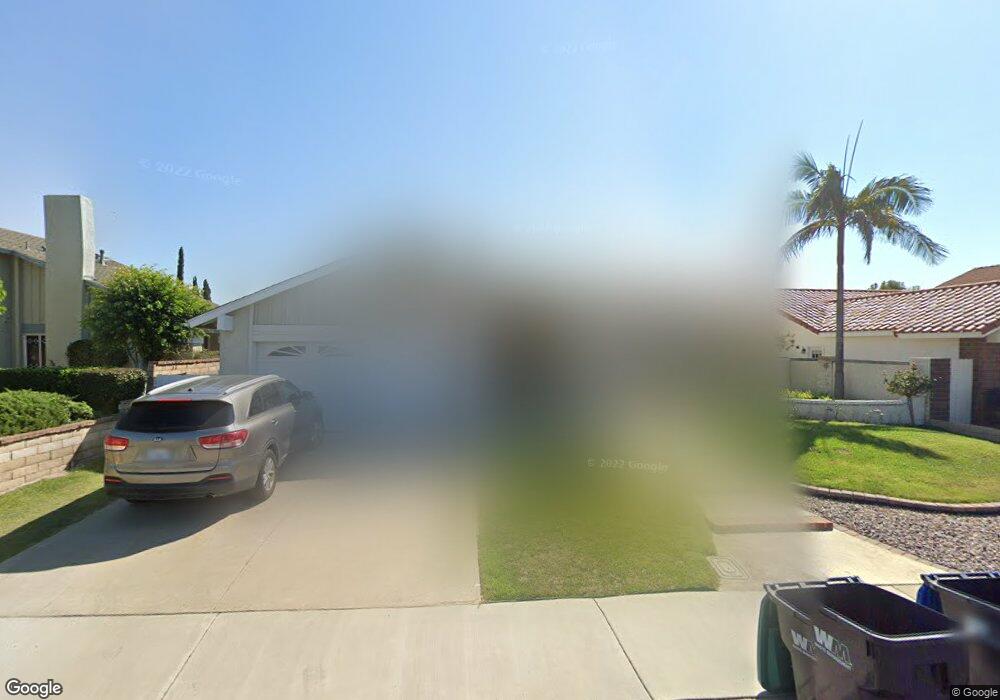
27432 Via Olmo Mission Viejo, CA 92691
Estimated Value: $1,128,000 - $1,276,000
3
Beds
2
Baths
1,470
Sq Ft
$806/Sq Ft
Est. Value
About This Home
This home is located at 27432 Via Olmo, Mission Viejo, CA 92691 and is currently estimated at $1,184,607, approximately $805 per square foot. 27432 Via Olmo is a home located in Orange County with nearby schools including Castille Elementary School, Newhart Middle School, and Capistrano Valley High School.
Ownership History
Date
Name
Owned For
Owner Type
Purchase Details
Closed on
Apr 1, 2014
Sold by
Madatian George and Madatian John J
Bought by
Madatian John J
Current Estimated Value
Purchase Details
Closed on
Apr 26, 2011
Sold by
Madatian Theresa
Bought by
Madatian John J
Purchase Details
Closed on
Jan 24, 2011
Sold by
Madatian Theresa
Bought by
Madatian George
Purchase Details
Closed on
Nov 17, 2007
Sold by
Madatian Theresa
Bought by
Madatian Theresa and Madatian John J
Purchase Details
Closed on
Jun 26, 2007
Sold by
Madatian Theresa
Bought by
Madatian Theresa and The Theresa Madatian Revocable Trust
Purchase Details
Closed on
Aug 15, 2001
Sold by
Madatian Theresa
Bought by
Madatian Theresa and Madatian John J
Purchase Details
Closed on
Sep 14, 1999
Sold by
Bisso James V and Bisso Linda L
Bought by
Madatian Theresa
Create a Home Valuation Report for This Property
The Home Valuation Report is an in-depth analysis detailing your home's value as well as a comparison with similar homes in the area
Home Values in the Area
Average Home Value in this Area
Purchase History
| Date | Buyer | Sale Price | Title Company |
|---|---|---|---|
| Madatian John J | $27,000 | First American Title Company | |
| Madatian George | -- | First American Title Company | |
| Madatian John J | -- | None Available | |
| Madatian George | -- | None Available | |
| Madatian Theresa | -- | None Available | |
| Madatian Theresa | -- | None Available | |
| Madatian Theresa | -- | -- | |
| Madatian Theresa | $216,000 | -- |
Source: Public Records
Tax History Compared to Growth
Tax History
| Year | Tax Paid | Tax Assessment Tax Assessment Total Assessment is a certain percentage of the fair market value that is determined by local assessors to be the total taxable value of land and additions on the property. | Land | Improvement |
|---|---|---|---|---|
| 2025 | $1,204 | $126,424 | $84,386 | $42,038 |
| 2024 | $1,204 | $123,946 | $82,732 | $41,214 |
| 2023 | $1,177 | $121,516 | $81,110 | $40,406 |
| 2022 | $1,153 | $119,134 | $79,520 | $39,614 |
| 2021 | $1,130 | $116,799 | $77,961 | $38,838 |
| 2020 | $1,118 | $115,602 | $77,162 | $38,440 |
| 2019 | $1,095 | $113,336 | $75,649 | $37,687 |
| 2018 | $1,072 | $111,114 | $74,165 | $36,949 |
| 2017 | $1,050 | $108,936 | $72,711 | $36,225 |
| 2016 | $1,029 | $106,800 | $71,285 | $35,515 |
| 2015 | $1,099 | $105,196 | $70,214 | $34,982 |
| 2014 | $530 | $49,042 | $22,011 | $27,031 |
Source: Public Records
Map
Nearby Homes
- 23251 Via Guadix
- 23032 Sonoita
- 22982 Cecelia
- 23382 Via Chiripa
- 23266 Via Ronda
- 23224 Coso Unit 51
- 23332 Coso Unit 134
- 23431 Via Guadix
- 22792 Orellana
- 23247 Cherry Hills St
- 23336 Via Bahia
- 23441 Via Ronda
- 27805 Barbate Unit 15
- 23372 Via Bahia
- 27882 Finisterra Unit 117
- 27879 Chipiona Unit 52
- 27887 Mazagon
- 27913 Trocadero Unit 68
- 23552 Bermuda Dunes
- 22642 Via Santiago